

Topology Studio — The Map of Your Environment Becomes Yours
Author live topology maps of your environment from real TrackMe entities — place, connect, share, and watch them update in real time. Views nest inside views, integrity checks keep every map honest, the canvas is yours to draw on — and because a map you cannot act on is just a picture, any topology also alerts: state-aware correlation that notifies the moment the picture degrades.
Key Capabilities
A Canvas, Not a Config
A full visual editor: place entities from any tenant and any monitoring component, draw dependency edges, group with live aggregates, brand nodes with your own icons — then draw on the canvas itself with shapes, images and free text, set an explicit canvas size, and just Save.
Aggregates That Build the Map for You
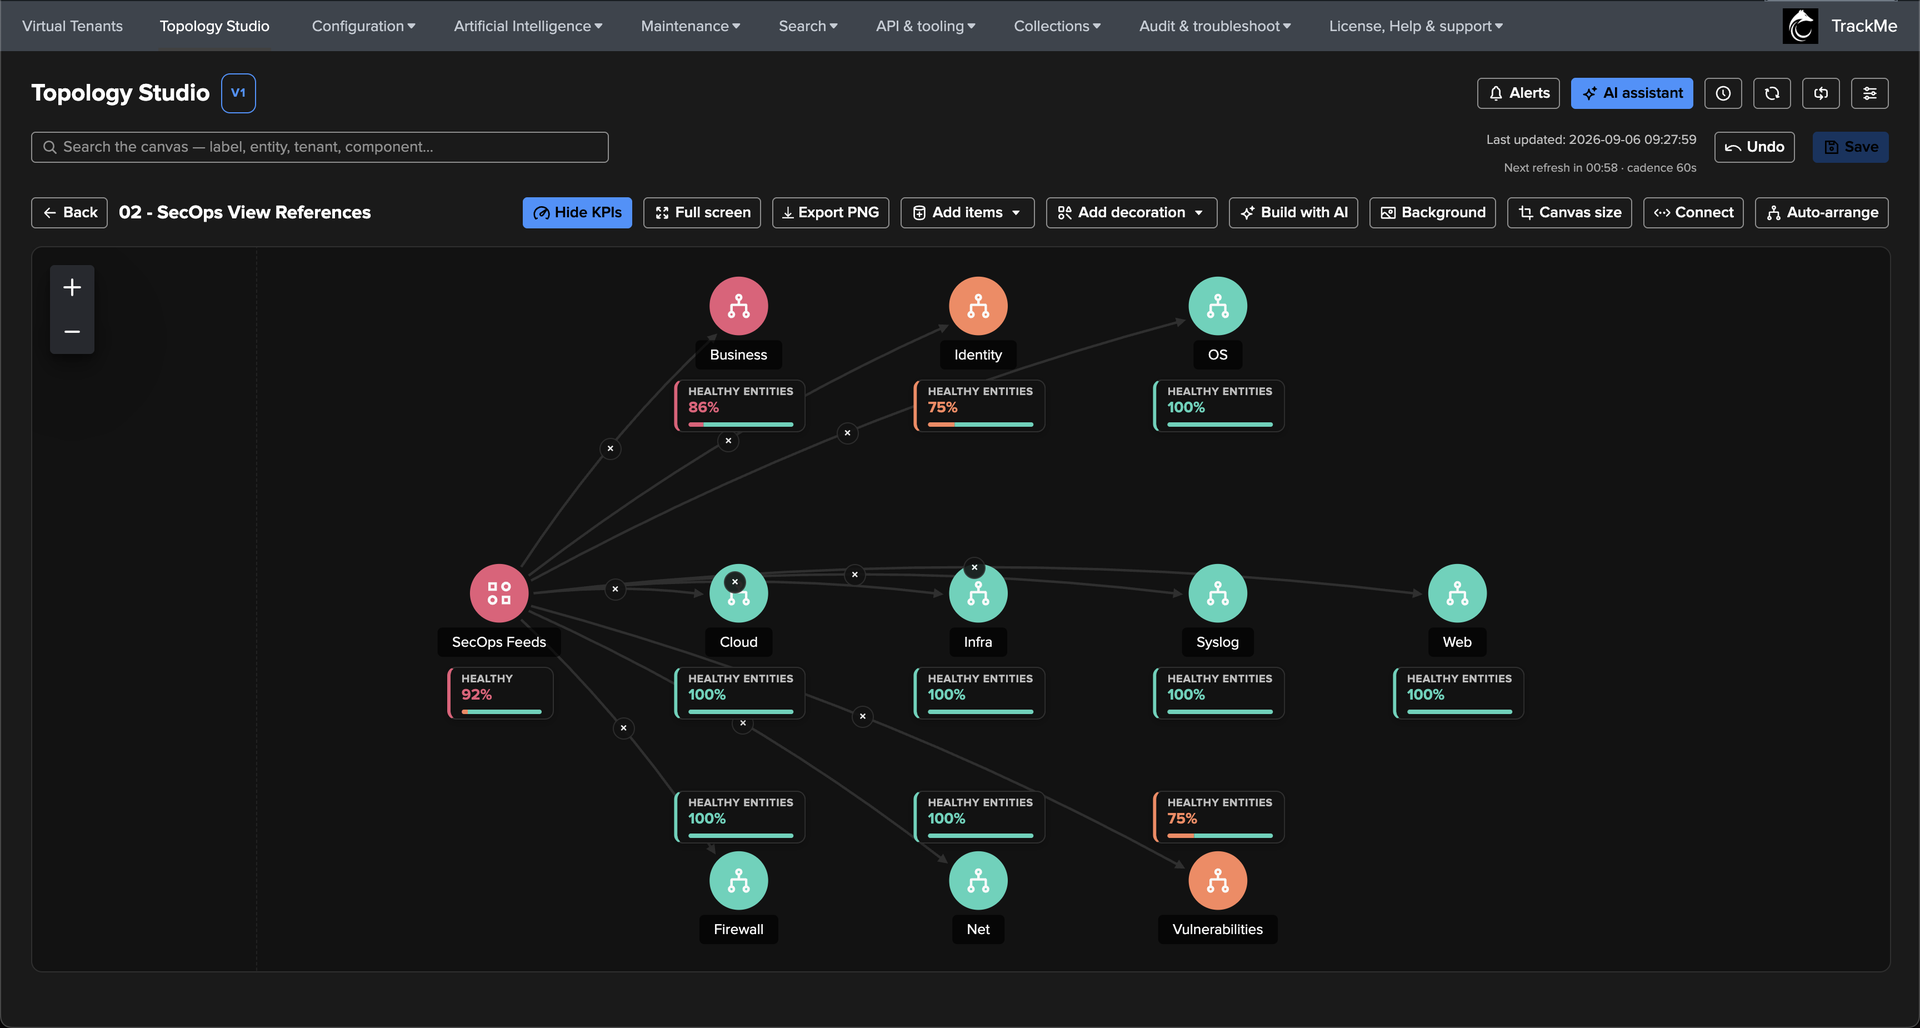
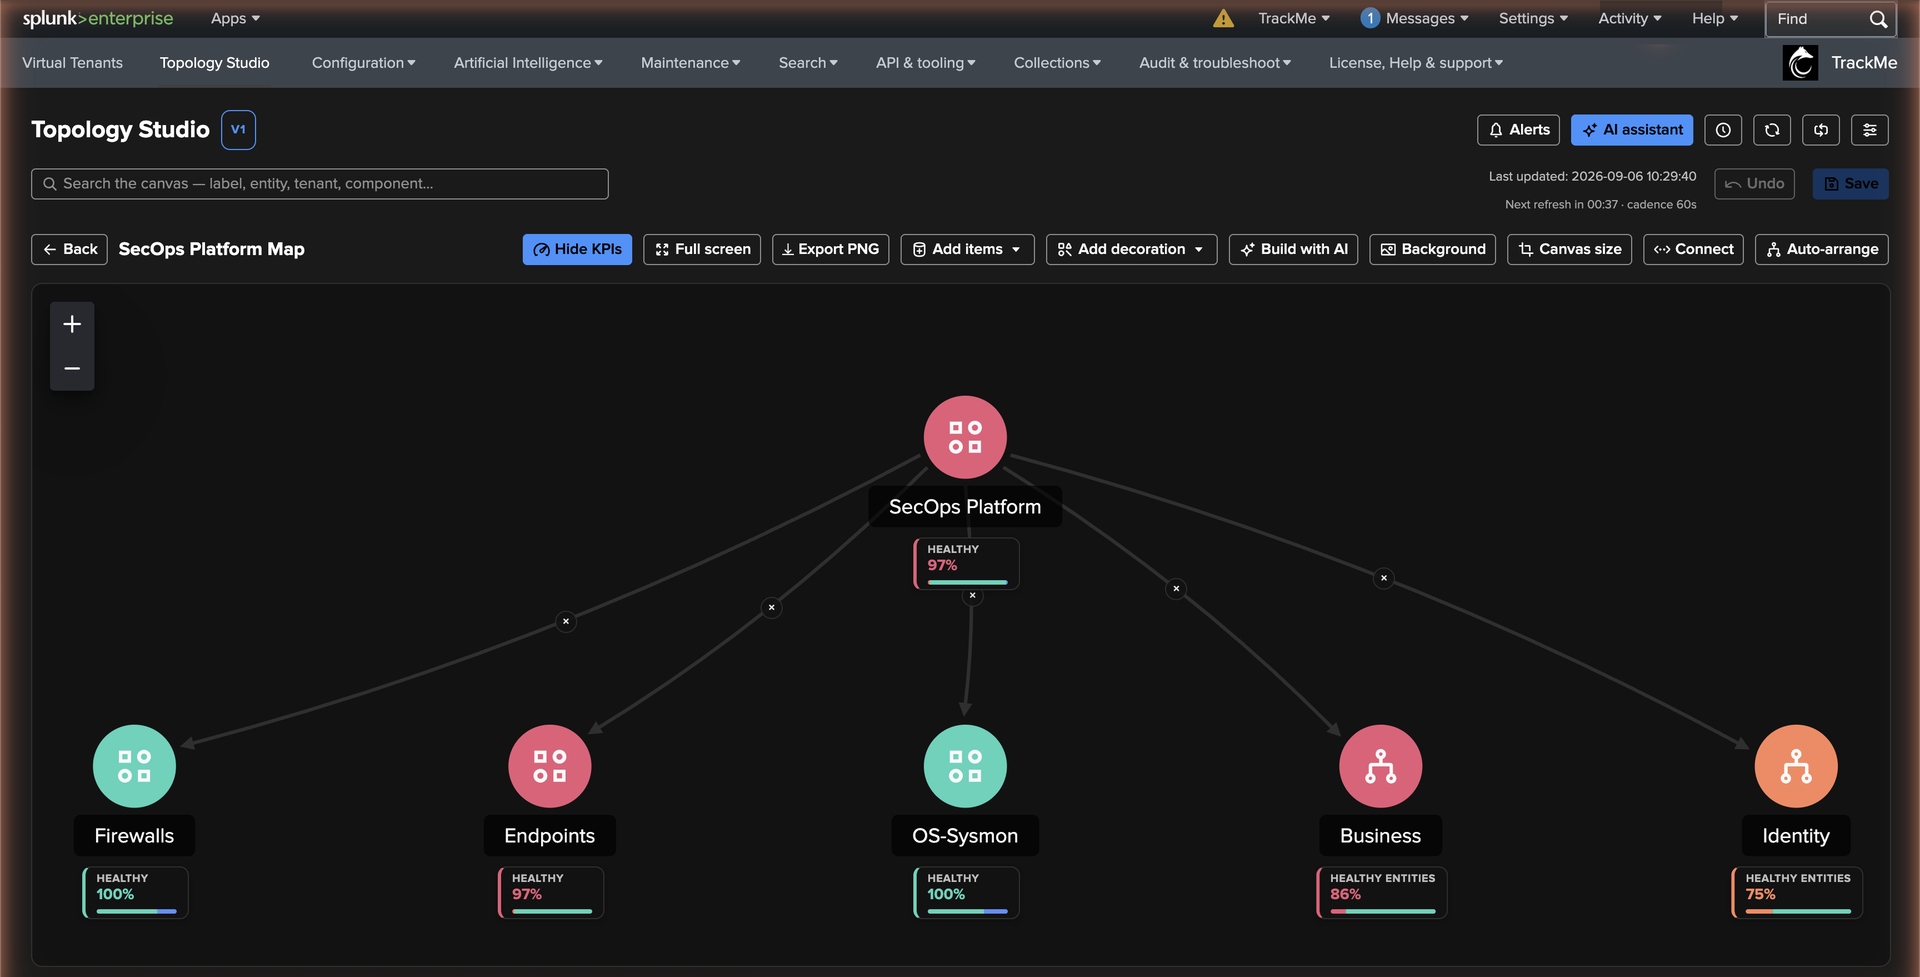
An aggregate node is a live scope + filter: it folds to worst state or a healthy-percentage band, and can auto-expand up to 500 members as linked nodes — new entities join the map by themselves, with default KPIs applied to every member and a configurable auto-arrange.
Views Inside Views
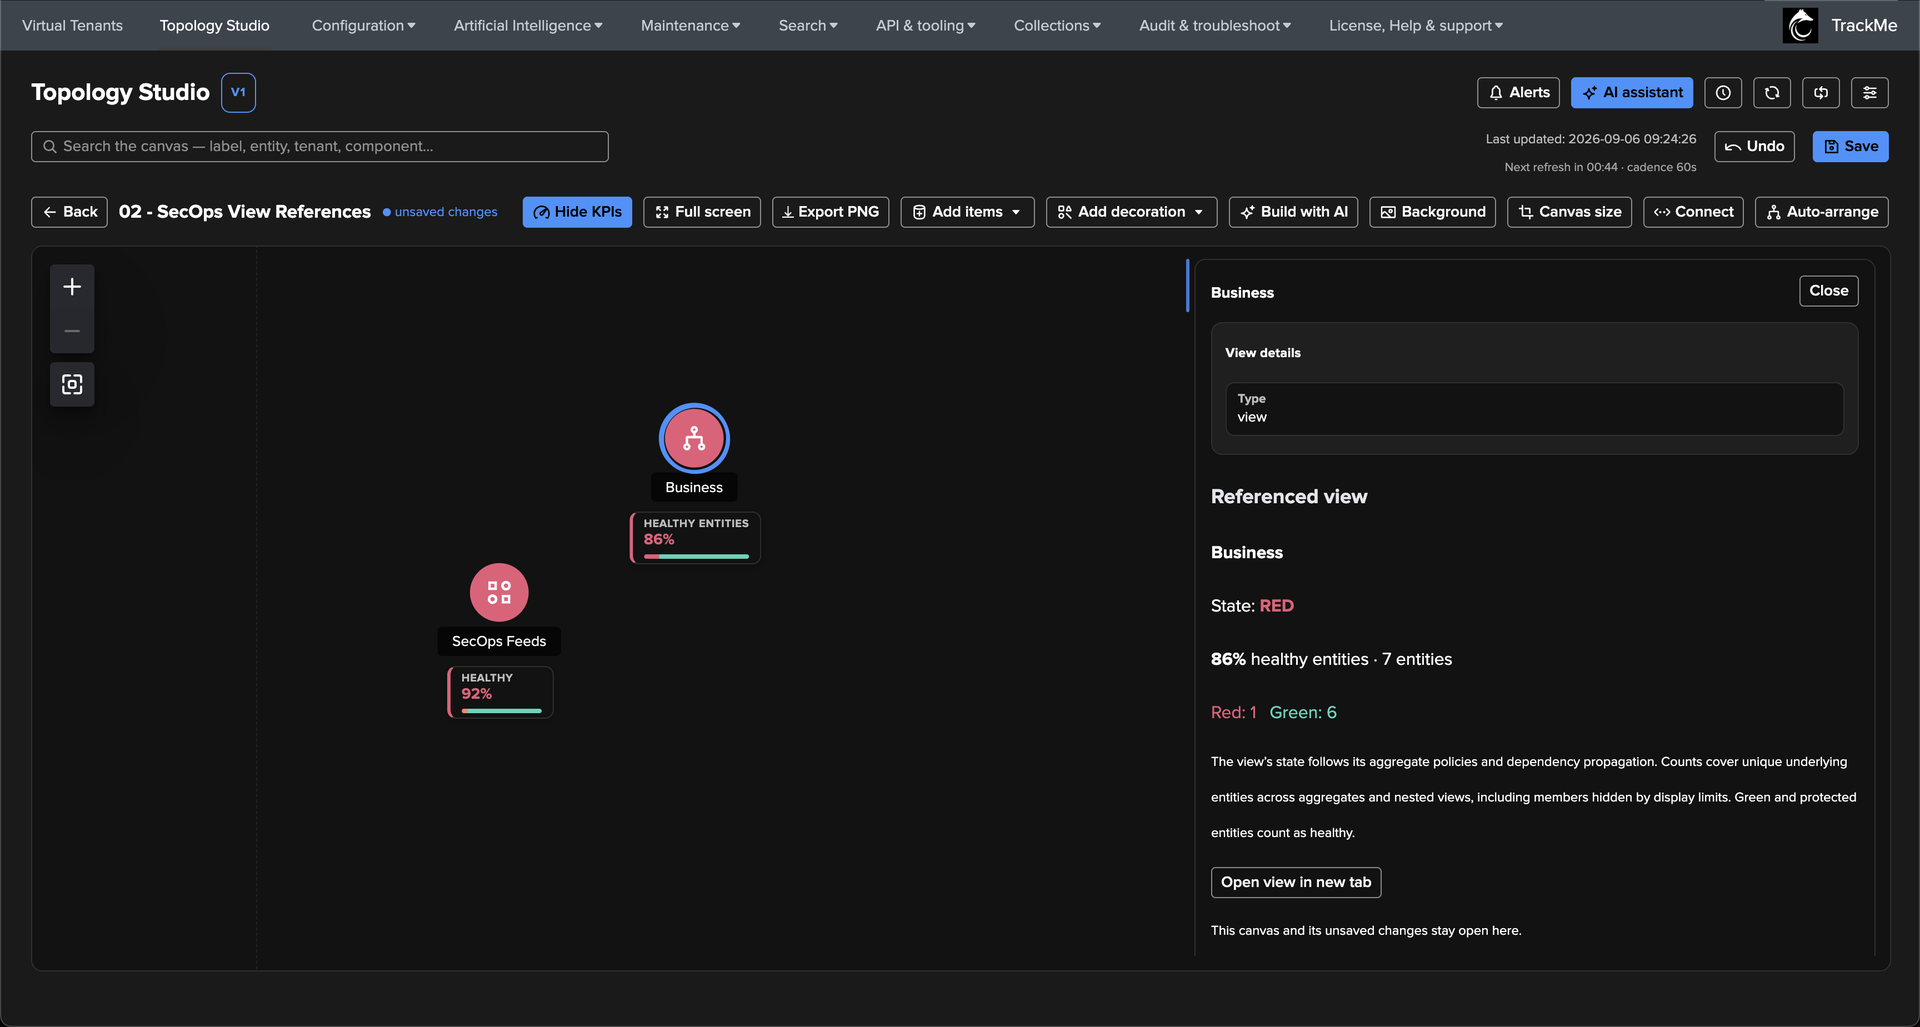
A saved view becomes a node on another canvas — the fourth node type. It rolls up the child’s worst effective state and counts its unique underlying entities, stays alertable and exportable, and turns a map into a map of maps: an estate modelled as layered, independently owned views with one honest roll-up.
Live KPIs and Sparklines on the Canvas
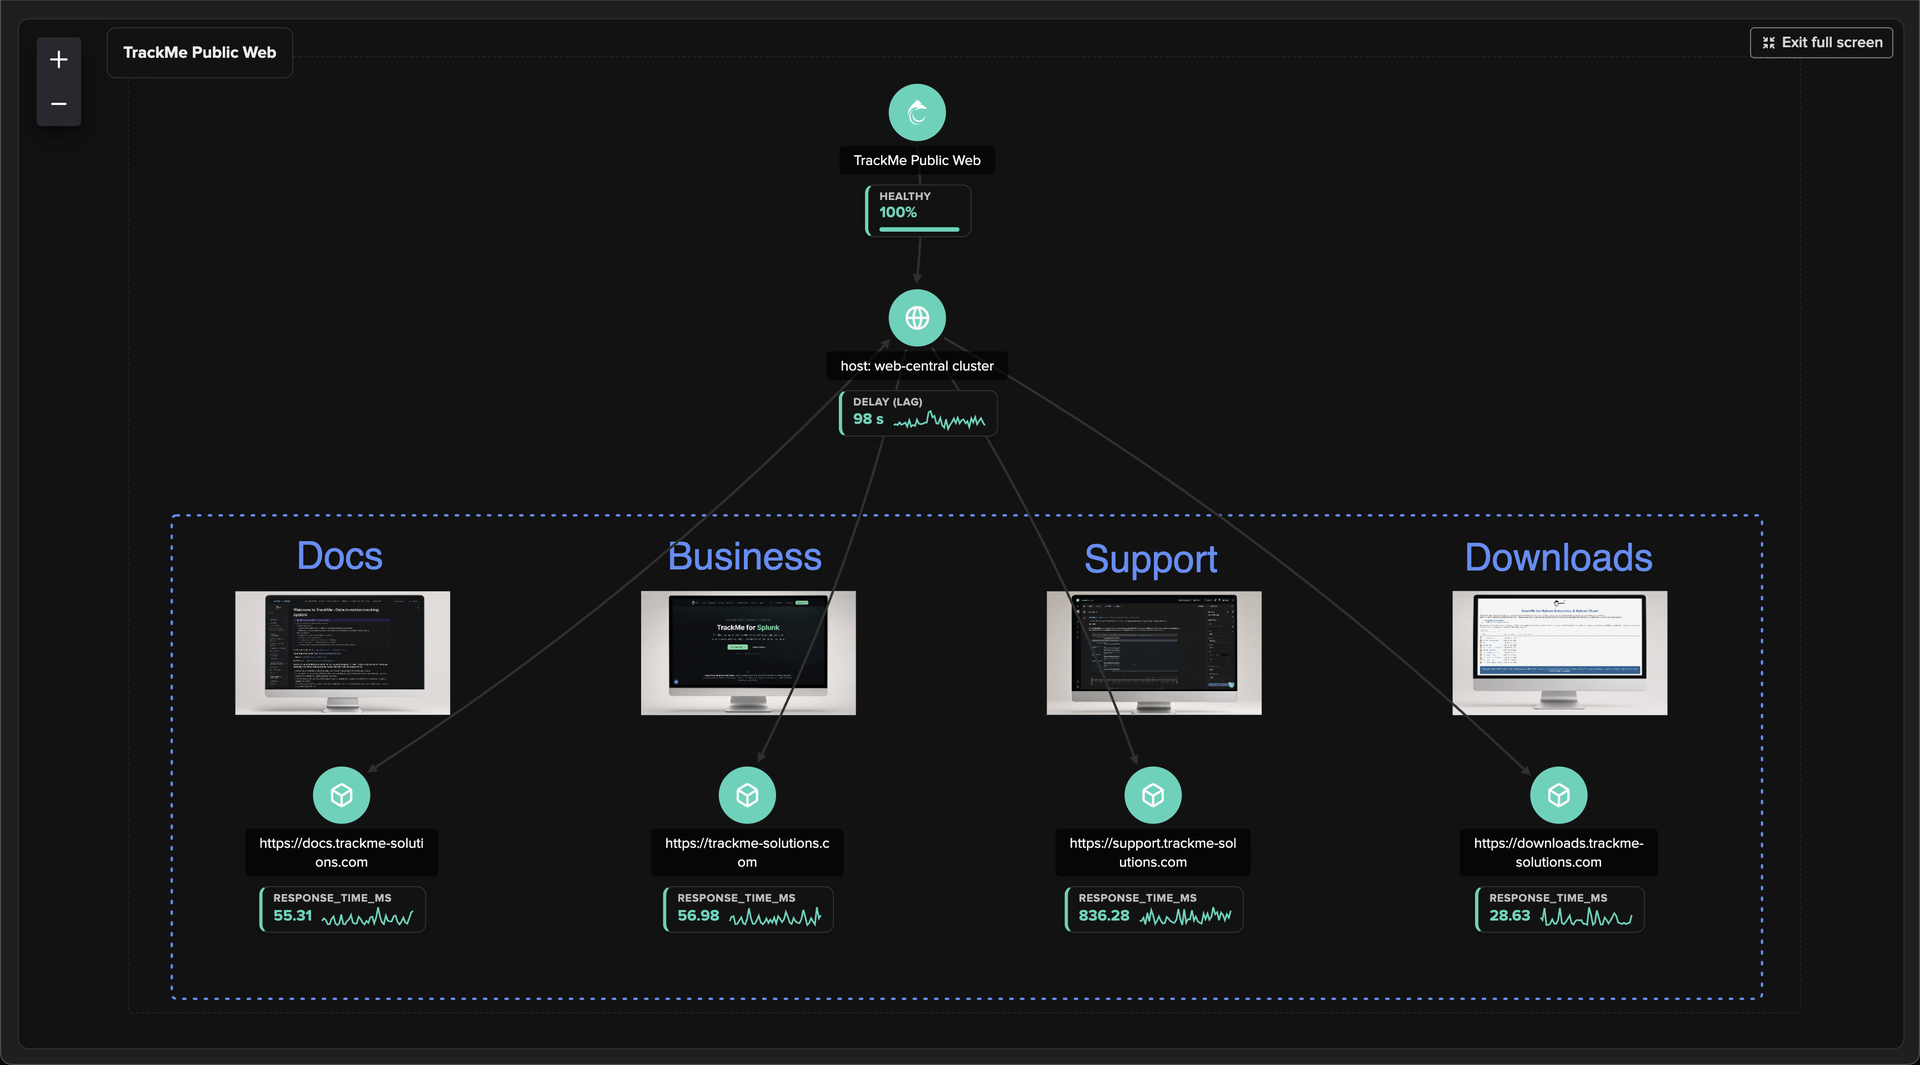
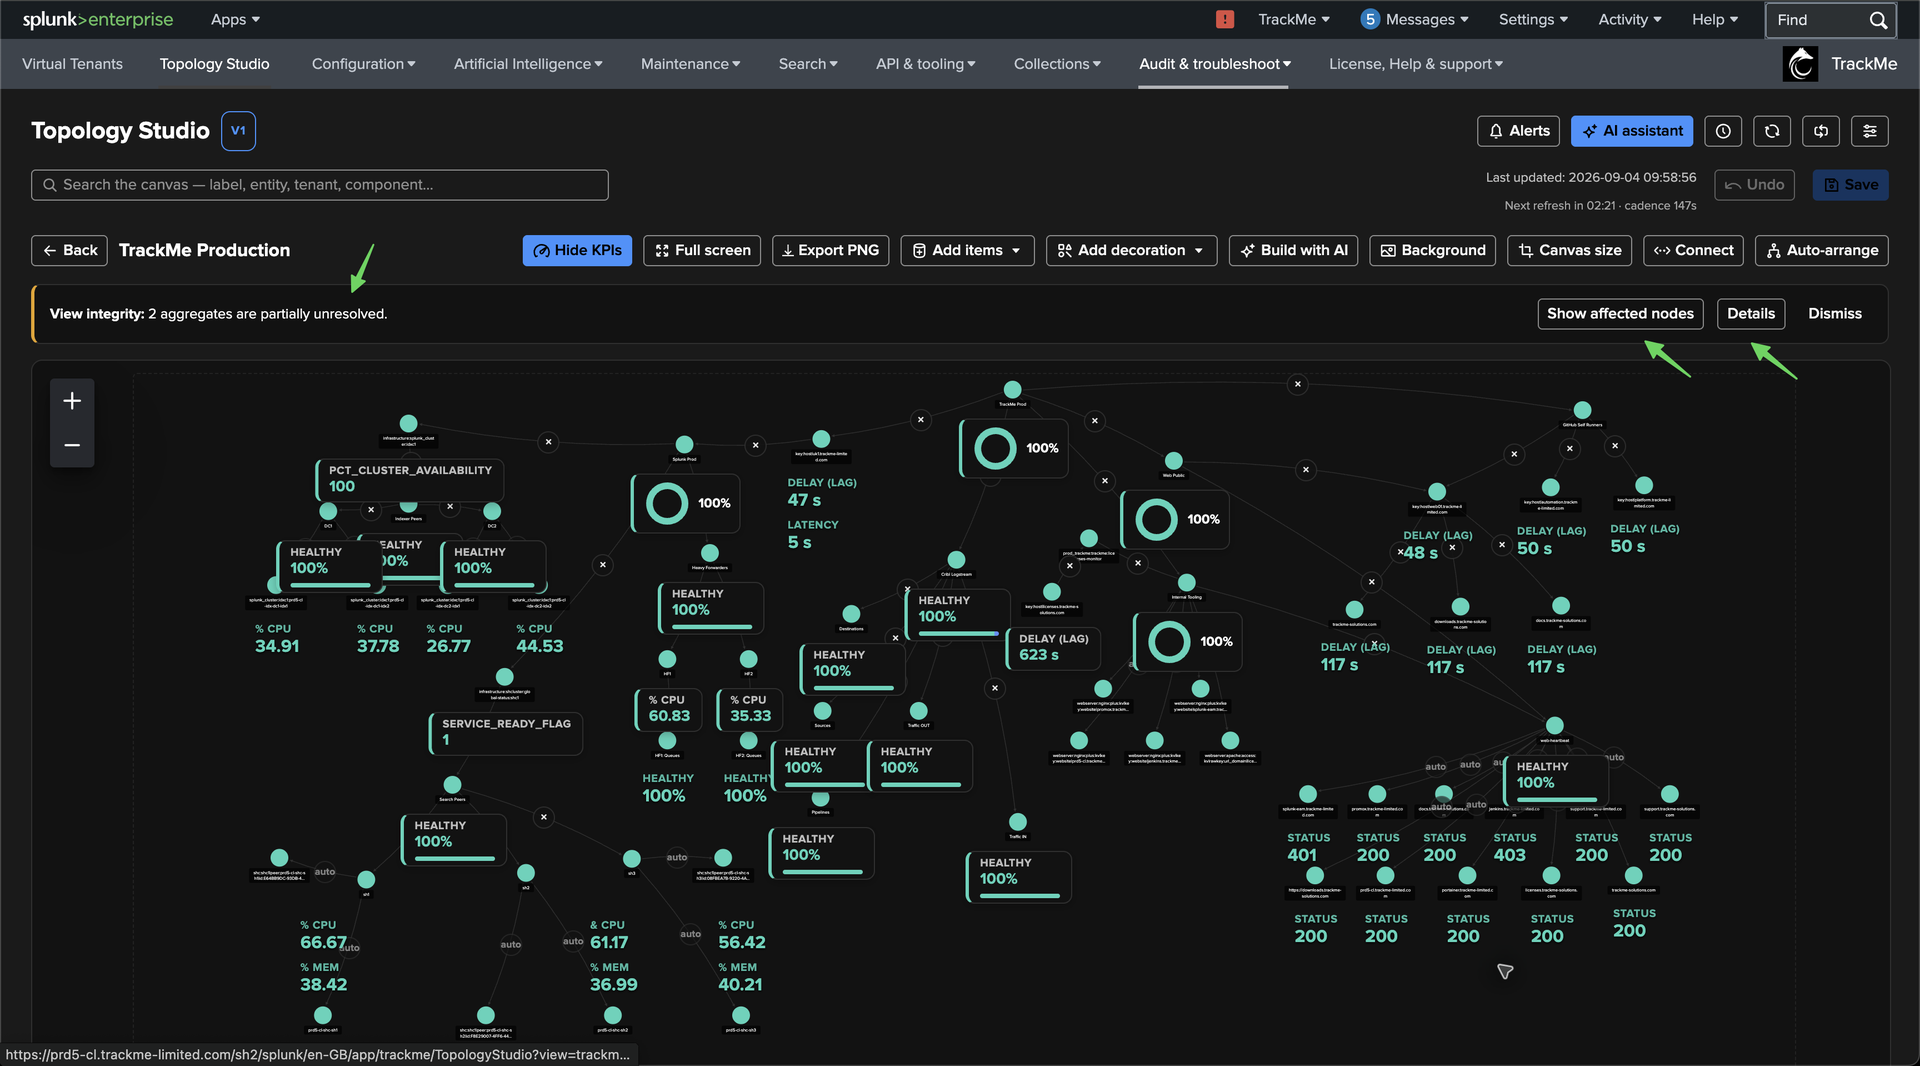
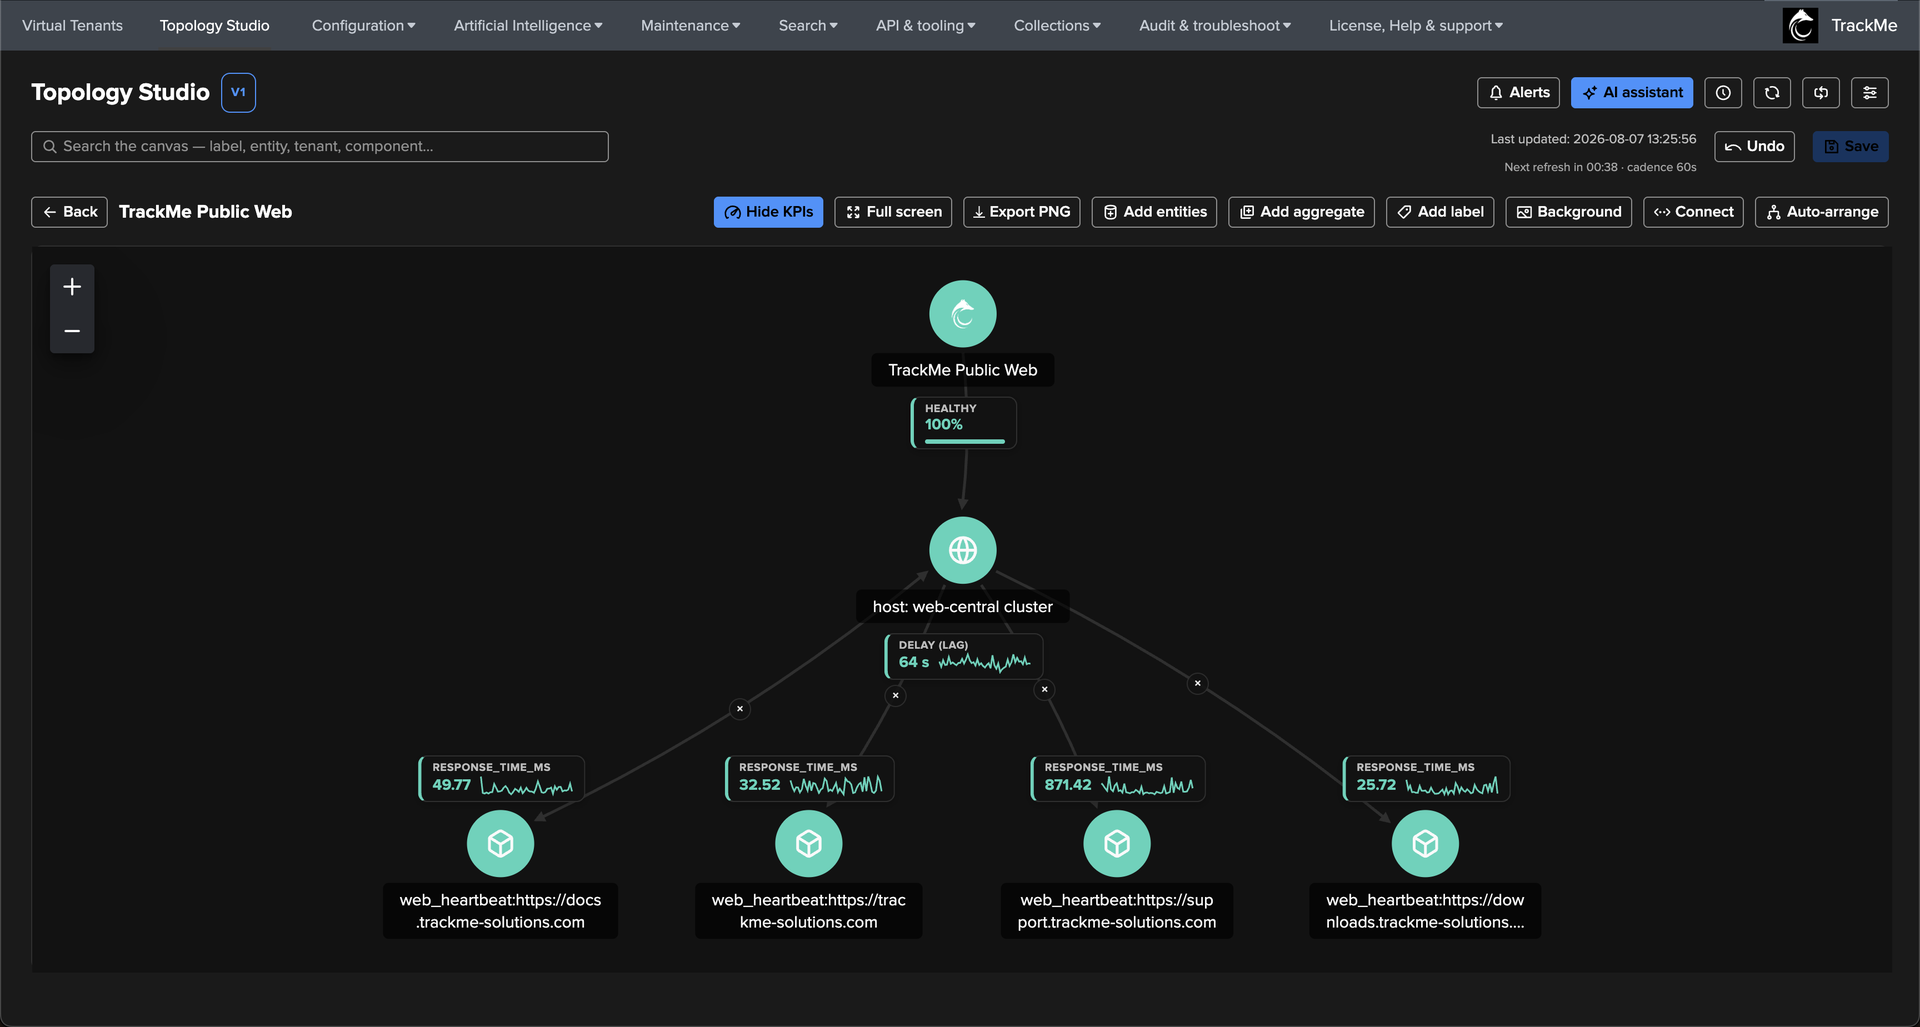
Stack up to five renamable KPI displays per node — HTTP status, response time, delay, lag, or any Flex metric — as stat cards, coloured values, badges, or sparklines: a 24-hour trend line right on the node, fetched by one batched search however many nodes carry it. The map is a living dashboard, not a diagram.
Topology Alerts — the Map That Calls You
State-aware correlation on everything the map covers, view nodes included: open on breach, update as the incident spreads, resolve on recovery — never notification spam. Missing stays missing, unavailable data and maintenance windows freeze rather than fake a transition. Every transition is an indexed event; emails embed the rendered map.
Integrity Checks That Keep Every Map Honest
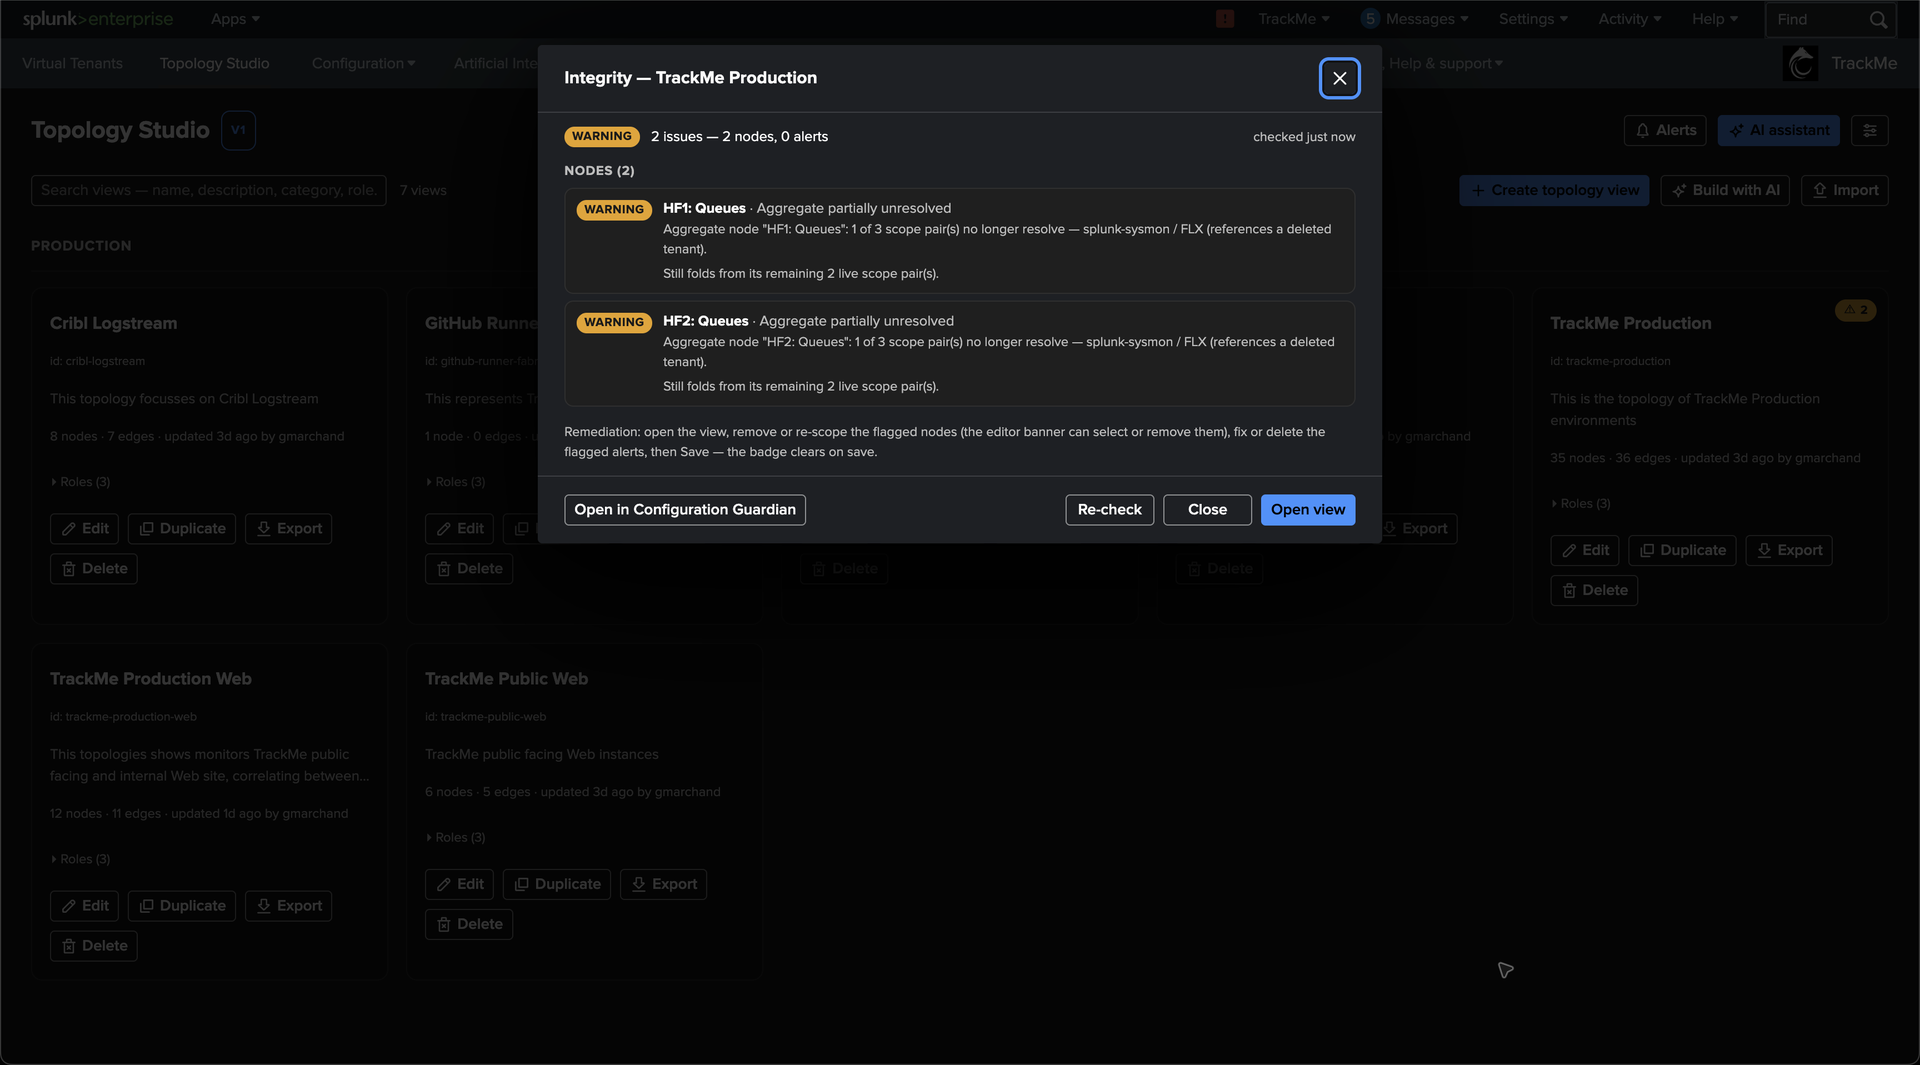
A Configuration Guardian check watches the views themselves: stale tenants and components, missing referenced views, orphaned or drifting alerts. Findings surface as a badge on the view, an integrity panel that explains each one, and an editor banner that removes stale nodes in one click.
Build With AI
Describe the map in plain language and TrackMe drafts it — aggregates with scopes and filters, pinned entities from your real inventory, dependency edges and view nodes — validated server-side and applied as one undoable pending change. The AI Assistant also explains and edits views in conversation, behind a consent card.
Built for the Wall and the Team
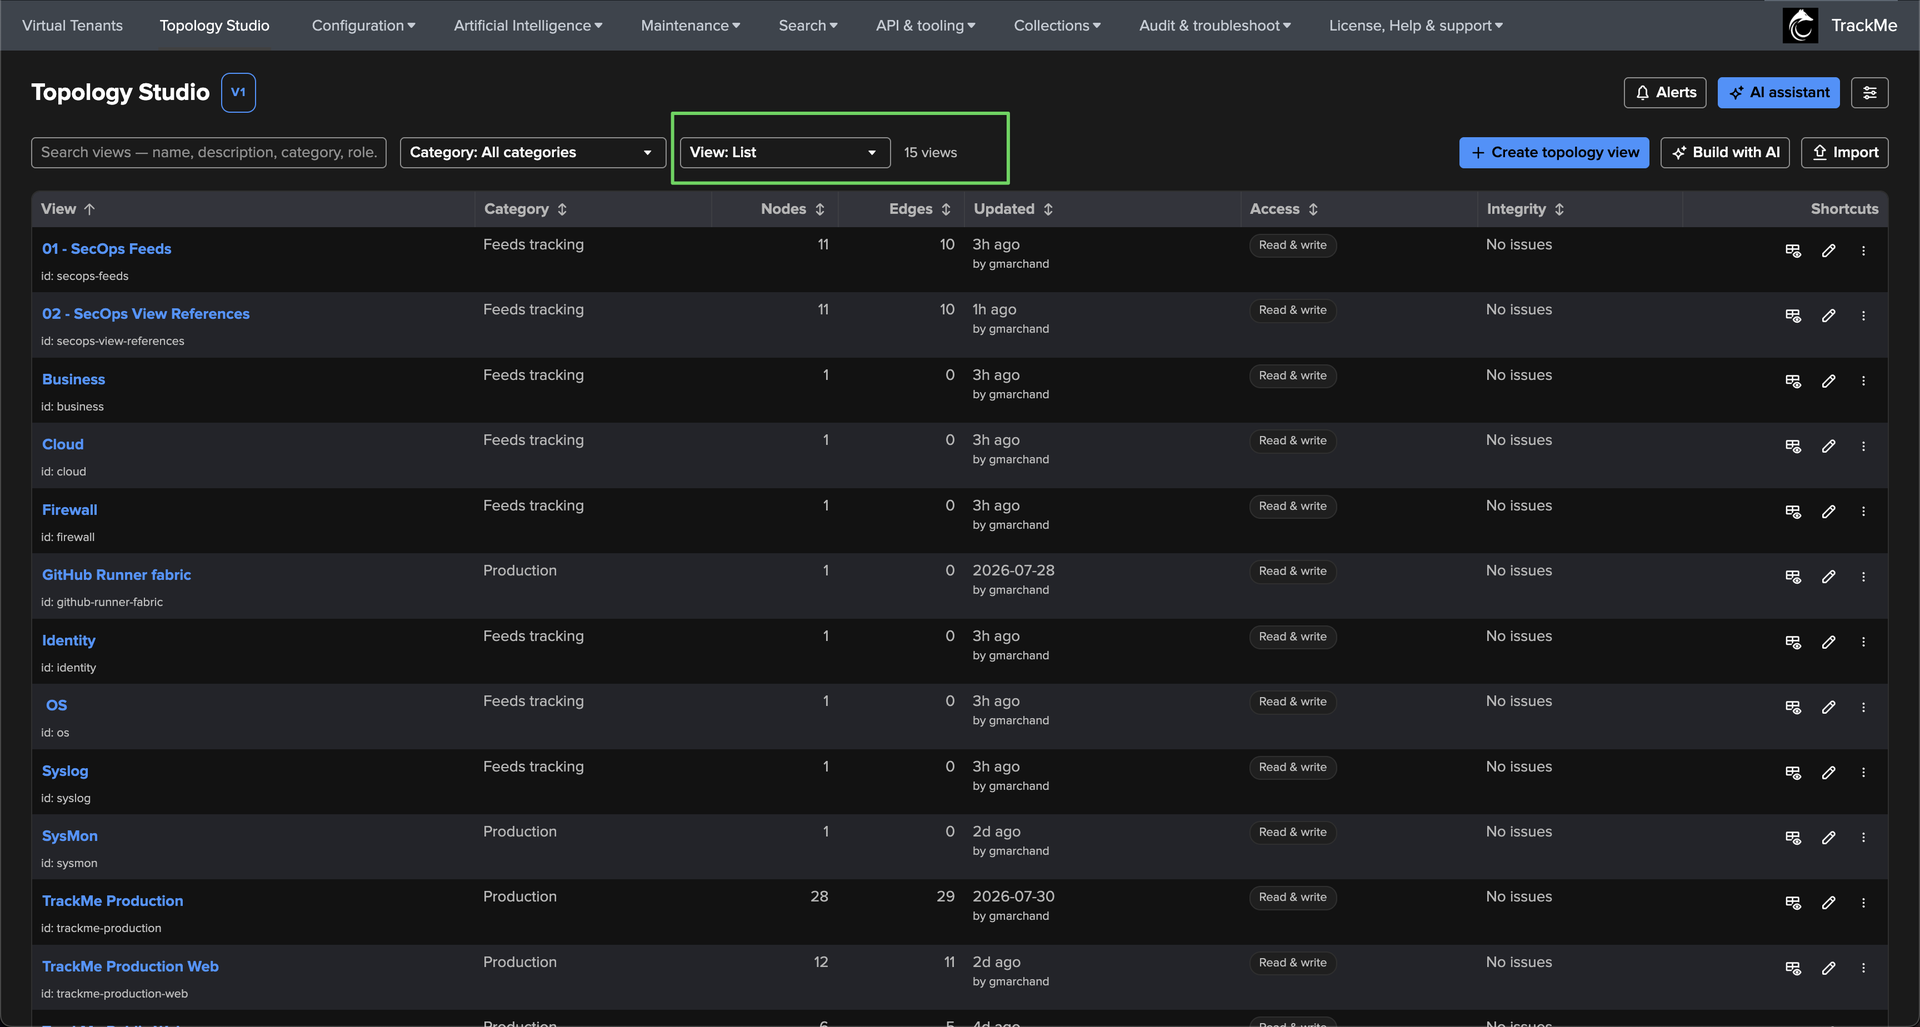
A views browser with Cards, Compact cards and a sortable List, a category filter and an admin-set default layout. Full-screen wall-of-screens mode, deep links, PNG export, per-view read/write RBAC, version history with non-destructive restore, and portable import/export.
Enterprise-Grade by Design
Server-side per-node tenant isolation — a shared map never extends anyone’s permissions, and a referenced view you cannot read looks exactly like a missing one. Available to every TrackMe edition, Foundation included.

Deep Dive
Explore the key aspects of Topology Studio in detail.


Your environment, as a living map
Every monitoring team draws the same picture on a whiteboard: the public services on one side, the internal platforms on the other, the arrows that explain why one failure becomes ten. Topology Studio turns that picture into a living object — built from the real entities TrackMe already monitors, coloured by their live state, refreshed continuously, and shared with exactly the teams you choose.
Pick entities from any tenant and any component — data sources, hosts, metrics, Flex Objects, field quality, workload — place them on the canvas, connect them, and the map takes care of itself from there.
Aggregates do the heavy lifting
The fastest way to build a map is to not build it entity by entity. An aggregate node captures a whole scope — tenants, components, and a filter using the same expression grammar as Virtual Groups — and folds it to a single live status: strict worst-member, or a healthy-percentage band you tune with two sliders.
Enable auto-expansion and the aggregate renders its current members as linked nodes around it — up to 500 of them, worst states first, each carrying the default KPI stack you chose. When monitoring discovers a new entity tomorrow, it appears on your map by itself.
Maps that build on maps
A saved view can itself be placed on a canvas as a view node — the fourth node type, next to entities, aggregates and labels. The referenced view keeps ownership of its graph, its policies and its own alerts; the parent stores the identifier, never a copy. The node folds to the child’s worst effective state, nested views and impact propagation included, while its KPI counts the unique underlying entities beneath it.
That is how an estate becomes a map of maps: layered, independently owned views, each rolled up into the one above it — with permissions checked at every hop, cycles refused, and nothing ever reporting green when it cannot be sure.
Maps that check themselves
Views age: tenants get deleted or disabled, components are removed, references stop resolving — and the alerts built on them can go quiet without anyone noticing. A Configuration Guardian check now detects exactly that. Findings surface where you work: an integrity badge on the view, an integrity panel explaining every finding, and an editor banner that selects or removes stale nodes in one click. Verdicts refresh on every save and every tenant lifecycle event, and clear the moment the view is repaired.
Trends and drawings on the canvas
The Sparkline KPI style turns each KPI into its label, current value and a 24-hour trend line drawn right on the node — direction, not just state — fetched by one batched search per view however many nodes carry it. And the canvas is a diagramming surface: shapes, images and free text frame a zone, title a branch or drop a screenshot of the service being watched, follow zoom and pan, and travel into PNG exports and alert emails.
When the picture degrades, the map calls you
Topology Alerts make the view an alerting object. A scheduled, state-aware engine evaluates everything the map covers — entities, aggregates and view nodes — and notifies on transitions only: an alert opens when the first item breaches, updates when the unhealthy set changes, and resolves on recovery, with the incident duration reported. No repetition, no spam. Missing stays missing; unavailable data, permission drift and global maintenance windows freeze the state rather than fabricate a transition.
Every transition is an indexed event ready for downstream correlation, and opt-in emails embed the server-rendered topology image — the same map, same icons, same colours — with a drilldown link straight back to the live view.
Describe it, and let AI draw it
Build with AI turns a plain-language description into a complete draft — aggregates with scopes and filters, pinned entities from your real inventory, dependency edges and view nodes — validated server-side and applied as one undoable pending change. The AI Assistant speaks Topology Studio natively: it explains how a view is built and evaluated, and can change it in conversation behind a consent card that shows exactly what will be written before you confirm.
From the NOC wall to the audit trail
The views browser scales with you: Cards, Compact cards or a sortable List, a category filter, and a deployment-wide default layout set by administrators. Full-screen mode turns any view into a wall display readable across the room. Deep links open a specific view directly; PNG export drops the current canvas into slides and incident timelines; import/export makes views portable between environments. Every save is a restorable version — roll back a layout experiment in two clicks, non-destructively.
And because topology views are shared objects, per-view RBAC separates who can watch from who can edit — while server-side, per-node tenant isolation guarantees a shared map never reveals more than each viewer’s own permissions allow.
Topology Studio was introduced in TrackMe 2.4.9 and is available to every edition — Foundation, Enterprise and Unlimited.
Related Features
Configuration Guardian
A modular framework that proactively detects misconfigurations and must-know con...
Stateful Alerting
Intelligent incident lifecycle management with state-aware alerts, rich HTML ema...
Cribl Integration
Twelve ready-made use cases turn Cribl’s internal metrics into monitored entitie...
Ready to get started?
Request a free 90-day trial with all features enabled. No restrictions.