

Cribl Stream Integration
Twelve ready-made use cases turn Cribl Stream’s own internal metrics into monitored entities — pipelines, routes, inputs, destinations and worker hosts — with nothing installed on Cribl. Arrange them into a living map in Topology Studio and alert on the whole deployment at once.
Key Capabilities
Nothing Installed on Cribl
Twelve ready-made Flex Object use cases — ten for Cribl Stream, two for Cribl Edge — built on native SPL against the internal metrics Cribl already ships to Splunk. No agents, no scripts, no change on the Cribl side.
One Entity per Moving Part
Every pipeline, route, input, destination and worker host becomes a monitored entity with a state, live metrics, 24-hour history and ML-learned baselines — across every worker group, from a single TrackMe instance.
A Living Map in Topology Studio
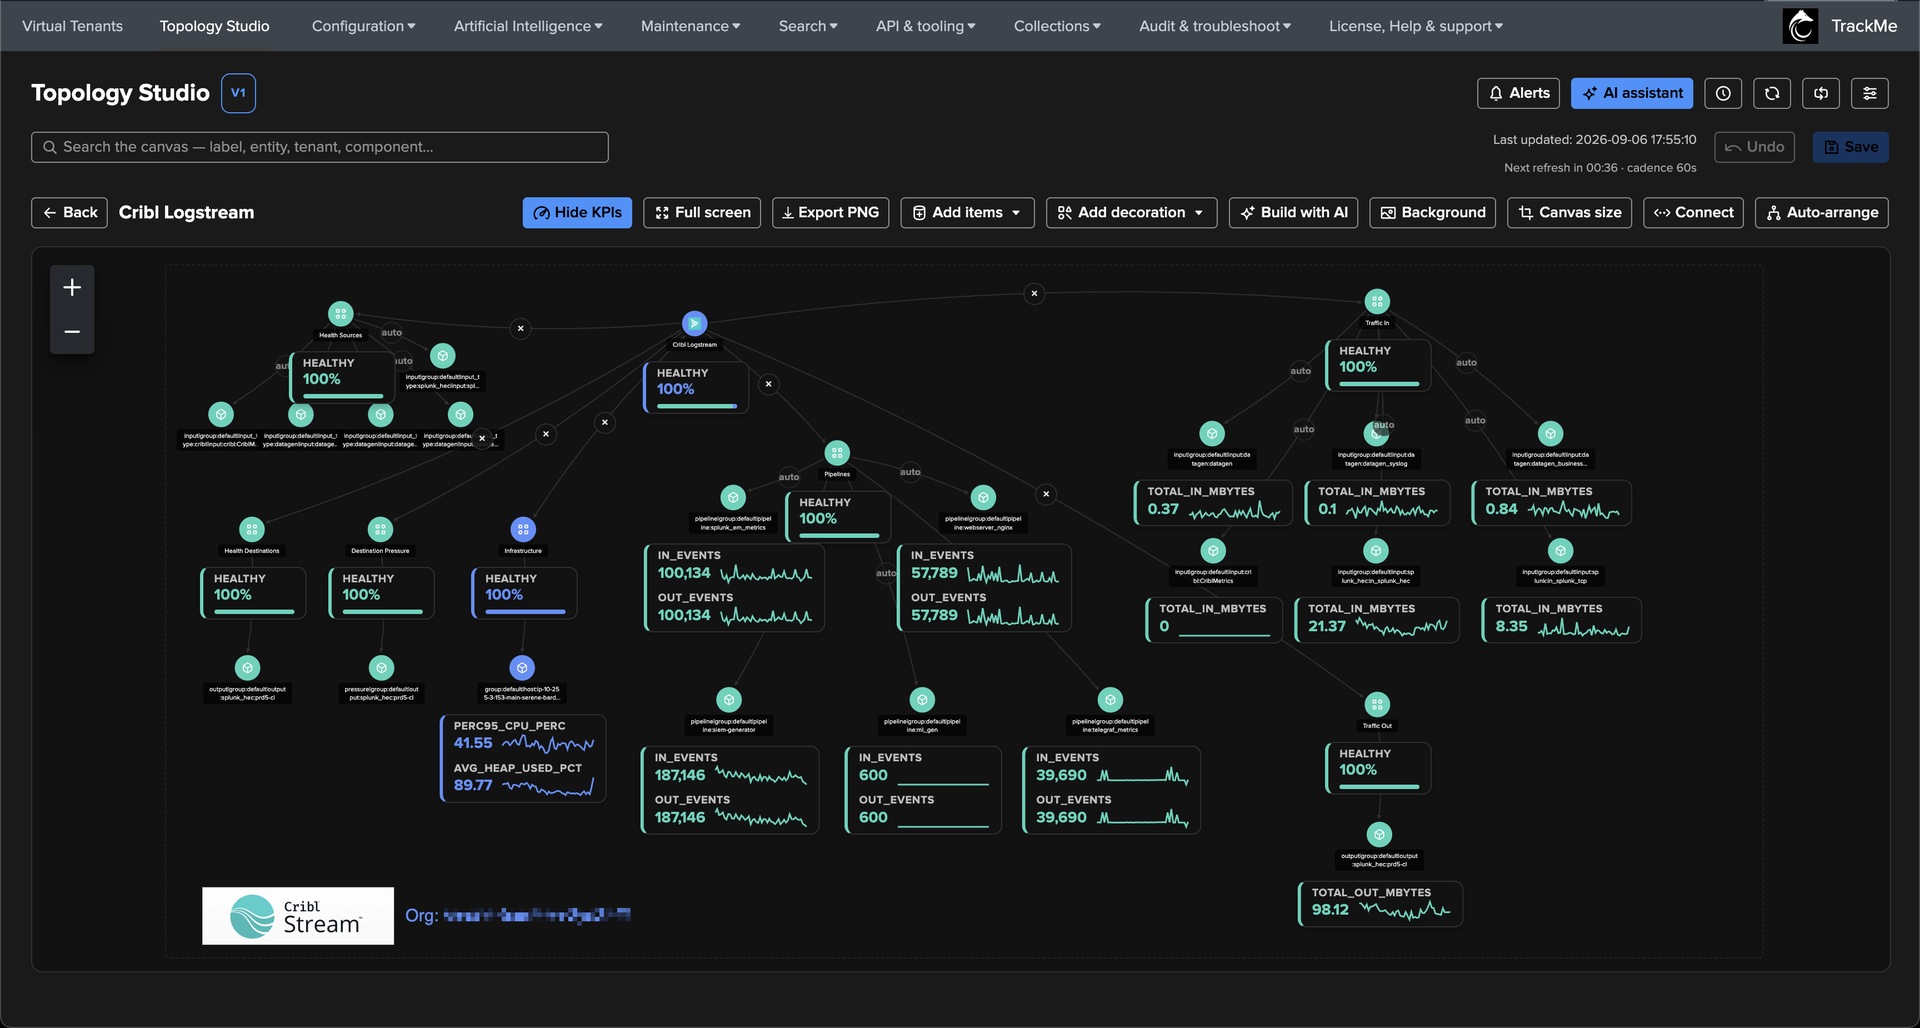
Arrange the Cribl entities into a topology: a root aggregate, one aggregate per group, auto-generated members with sparkline KPIs. A pipeline added on the Cribl side is on the map at the next refresh.
A Picture That Reads Itself
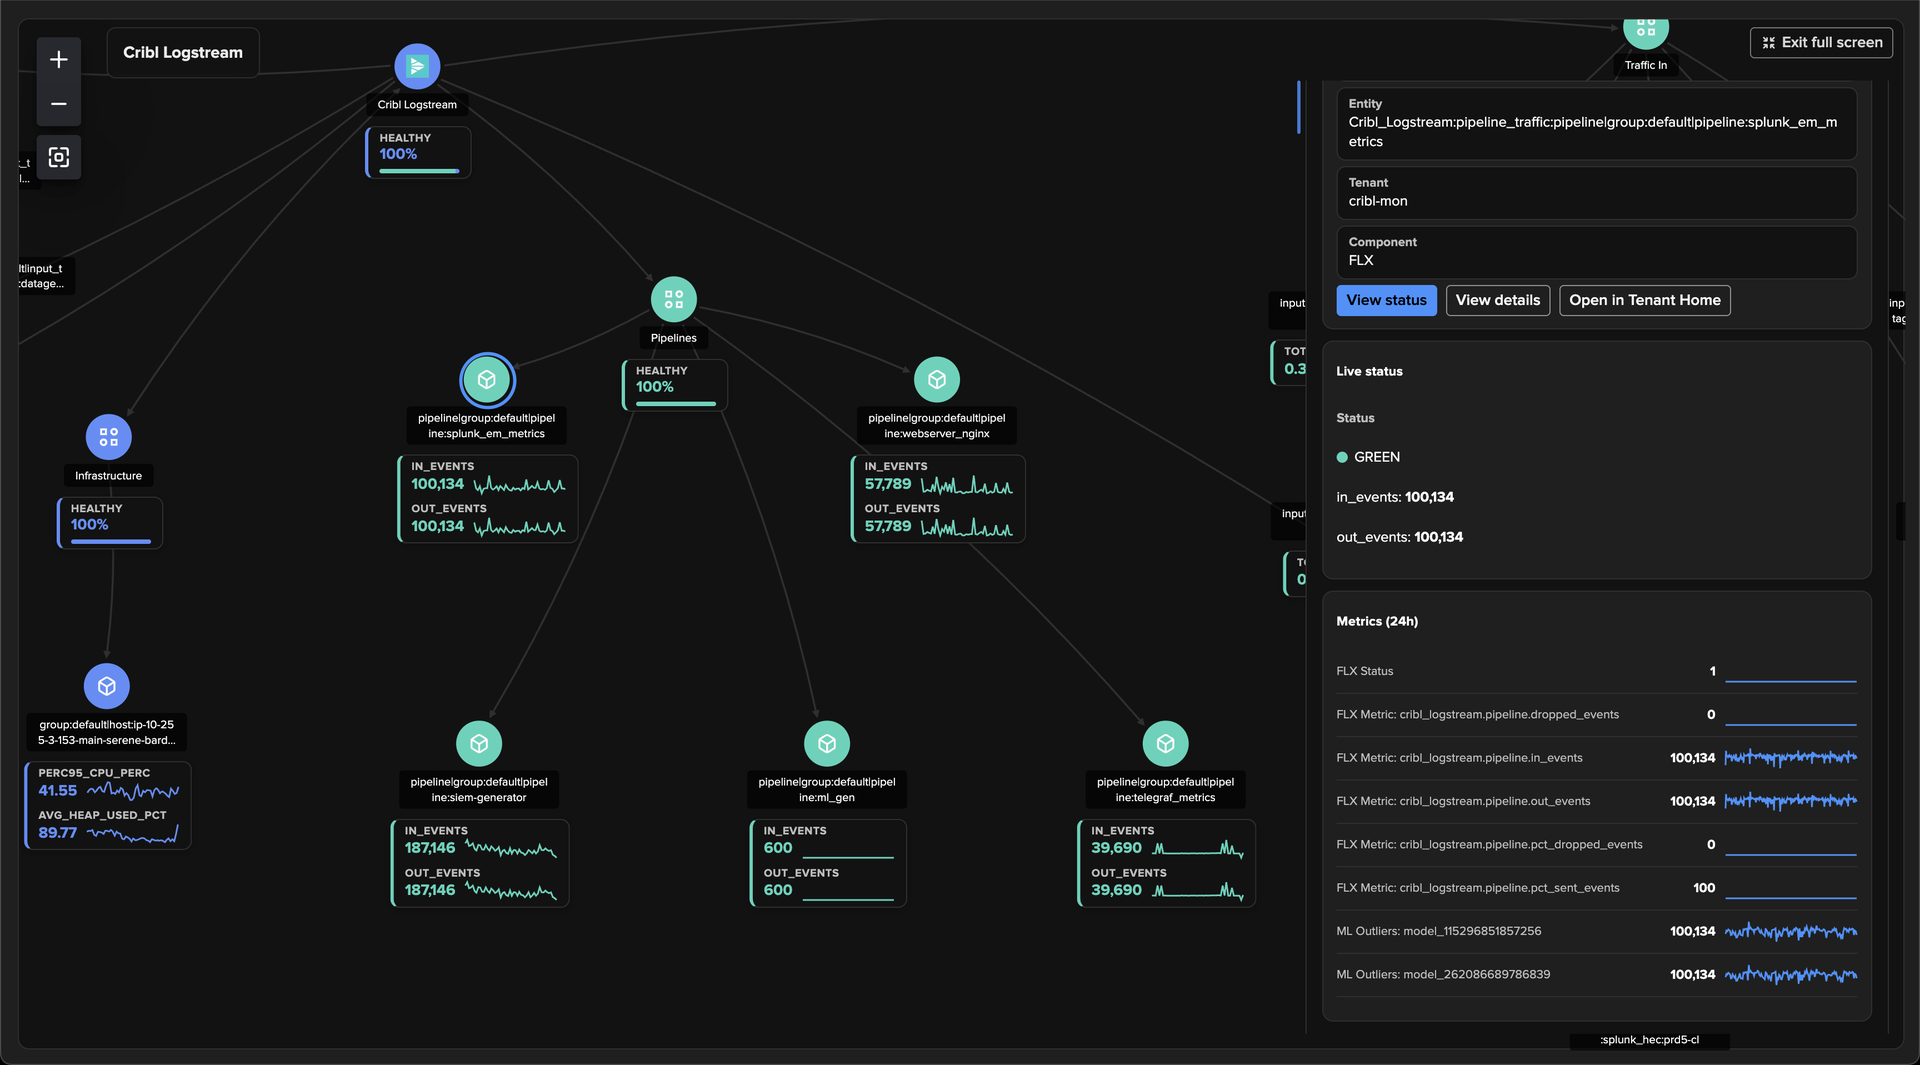
A pipeline turns red on an outlier, its group drops to 80% healthy, the root re-classifies, a worker host goes blue — visible at a glance in full-screen mode, with the selected host’s live metrics in the inspector.
Health & Destination Monitoring
Continuously monitor destination health, backpressure events and delivery failures. Get alerted when destinations become unreachable or when delivery rates drop unexpectedly.
One Alert for the Whole Deployment
Put a Topology Alert on the view: state-aware, no spam by design, with the rendered map inside the email. Every use case stays a fully editable Flex Object, integrated with alerting, maintenance and RBAC.


Deep Dive
Explore the key aspects of Cribl Integration in detail.



From entities to a living map
Cribl Stream sits in the middle of the data path: every pipeline, route, pack and destination is a place where data can slow down, get dropped or stop. TrackMe turns Cribl’s internal metrics into monitored entities — one per pipeline, route, input, destination and worker host — then lets you arrange them into a living map of your Cribl deployment with Topology Studio.
The map in the guide is a handful of aggregates and the edges between them: a root scoped to the important Cribl entities, one aggregate per group, and auto-generated members carrying sparkline KPIs — in and out events per pipeline, MBytes per input and output, CPU and heap per host. Impact propagation from the worker hosts repaints the whole deployment when nothing can flow, and a single Topology Alert covers it end to end.
Read the Cribl Stream monitoring guide to set it up in minutes — or describe the map to Build with AI.
Related Features
Ready to get started?
Request a free 90-day trial with all features enabled. No restrictions.