

Splunk UF Fleet Monitoring — Every Forwarding Agent, at Any Fleet Size
Know which forwarding agents are connected, on which versions, and which are failing — from the receivers' own view of the fleet, with no heartbeat to deploy. Mass events are one finding, Deployment Servers are watched too, and 28 built-in policies cover the agents, the fleet and the Deployment Servers.
Key Capabilities
Connected From the Data Path
An agent is connected when a Splunk receiver saw it within the connected window. The receivers describe the whole fleet, whatever its size — no heartbeat to deploy, no agent polled, nothing installed.
Mass Events Are One Finding
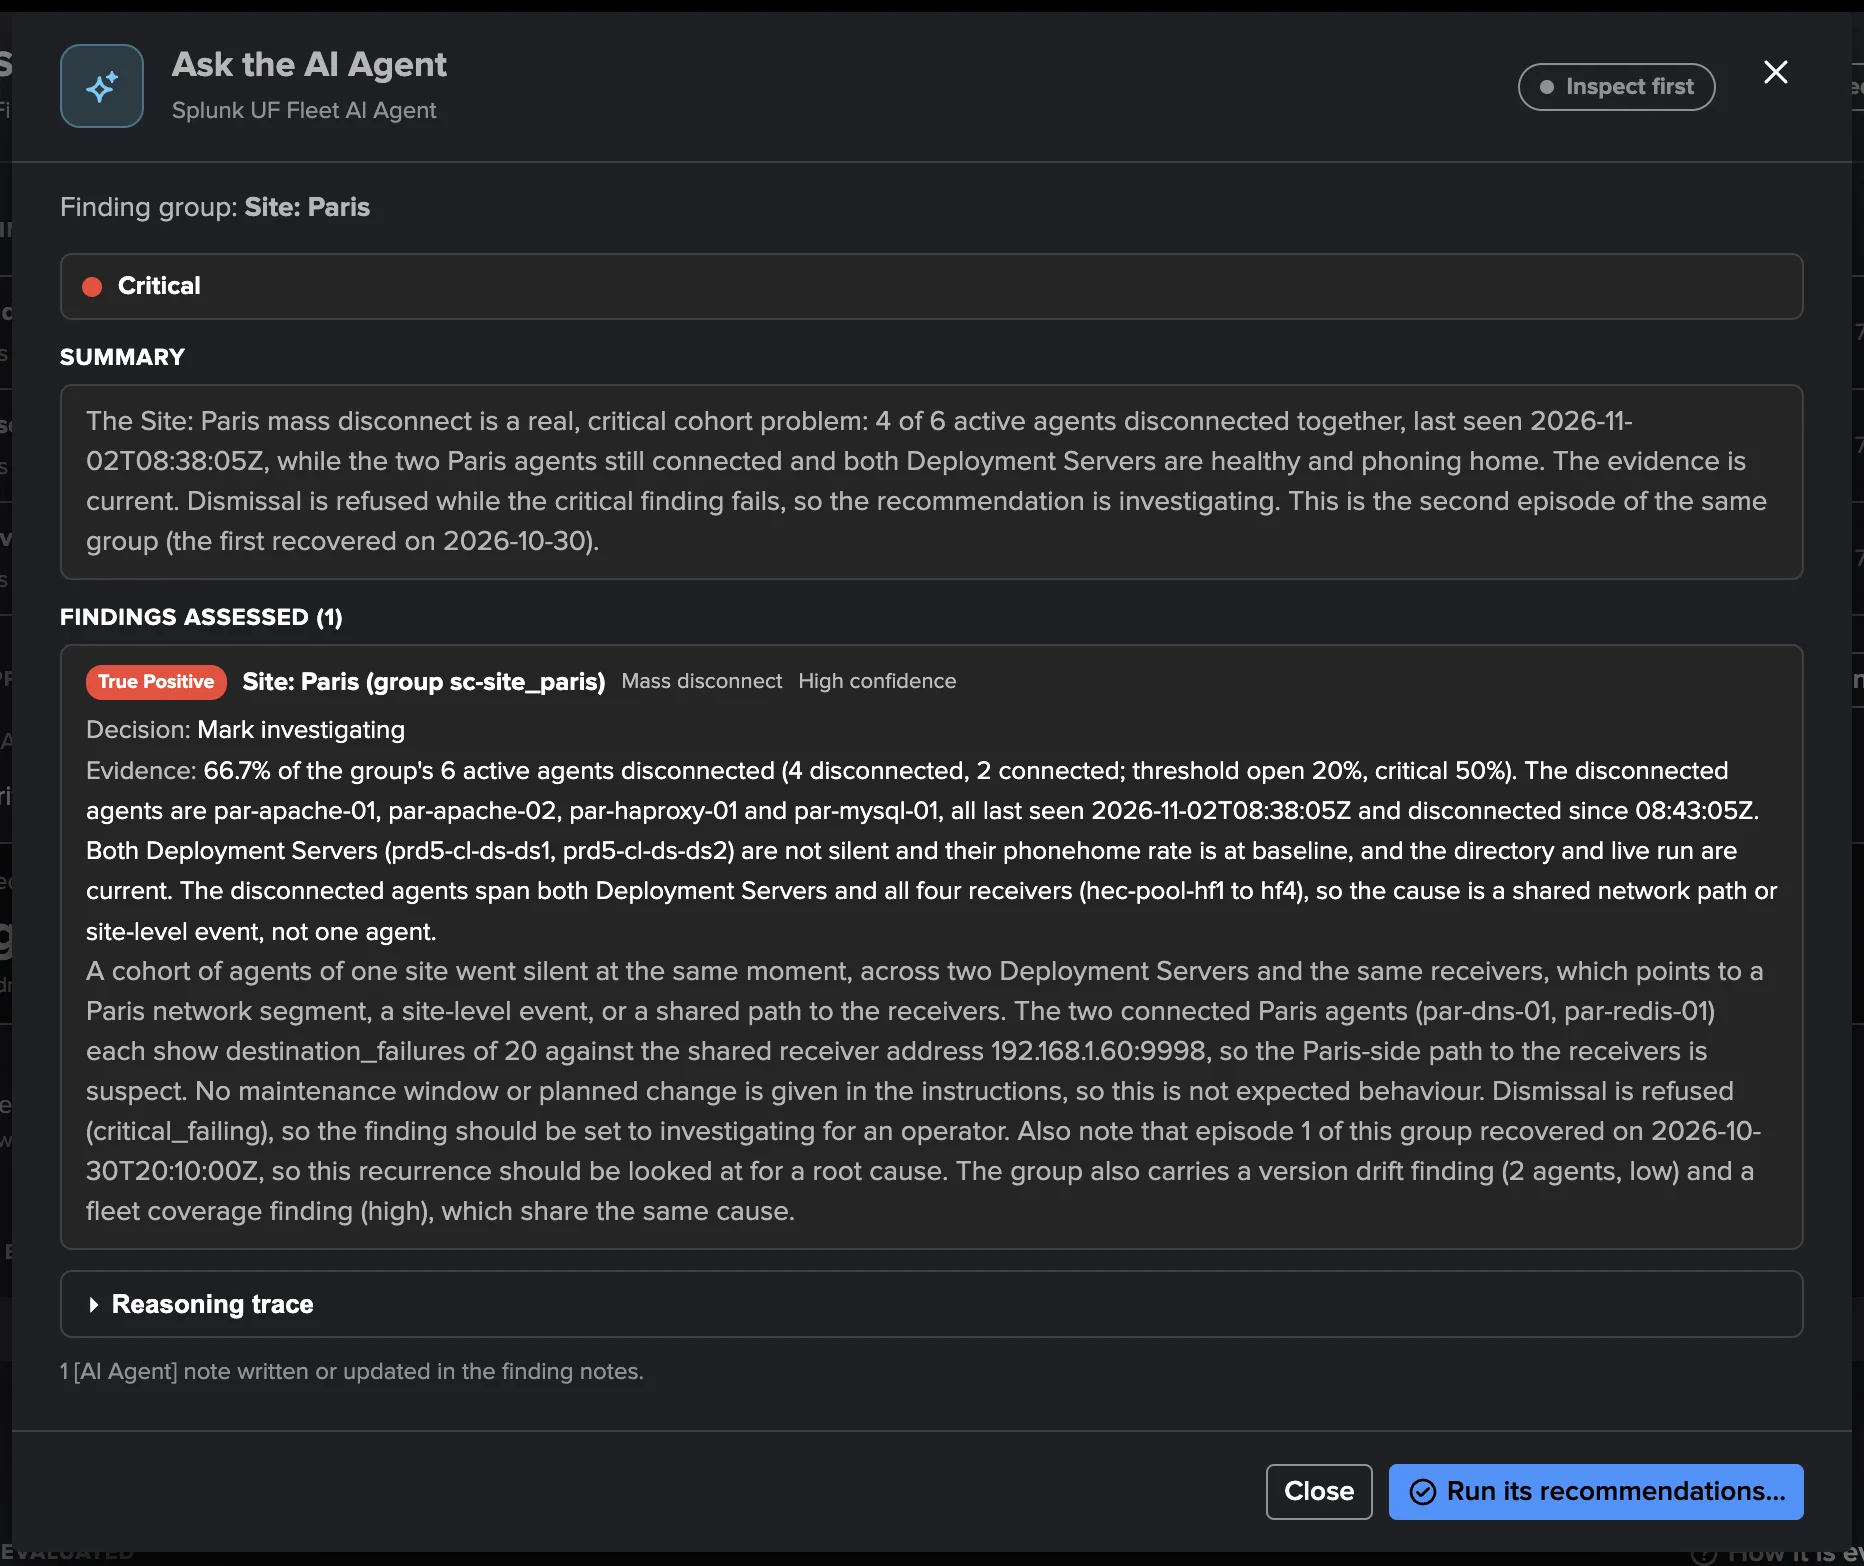
A network cut, a receiver tier down, a bad outputs push: one Mass disconnect finding on the fleet or on the group says it, and the agents' own findings are held — never a flood of one alert per agent.
28 Built-In Policies
Output blocked, destinations failing, throughput throttled, restart loops, input errors, cloned identities, version drift and unsupported versions, expected agents missing, fleet coverage, and the health of every Deployment Server.
Groups and Your CMDB
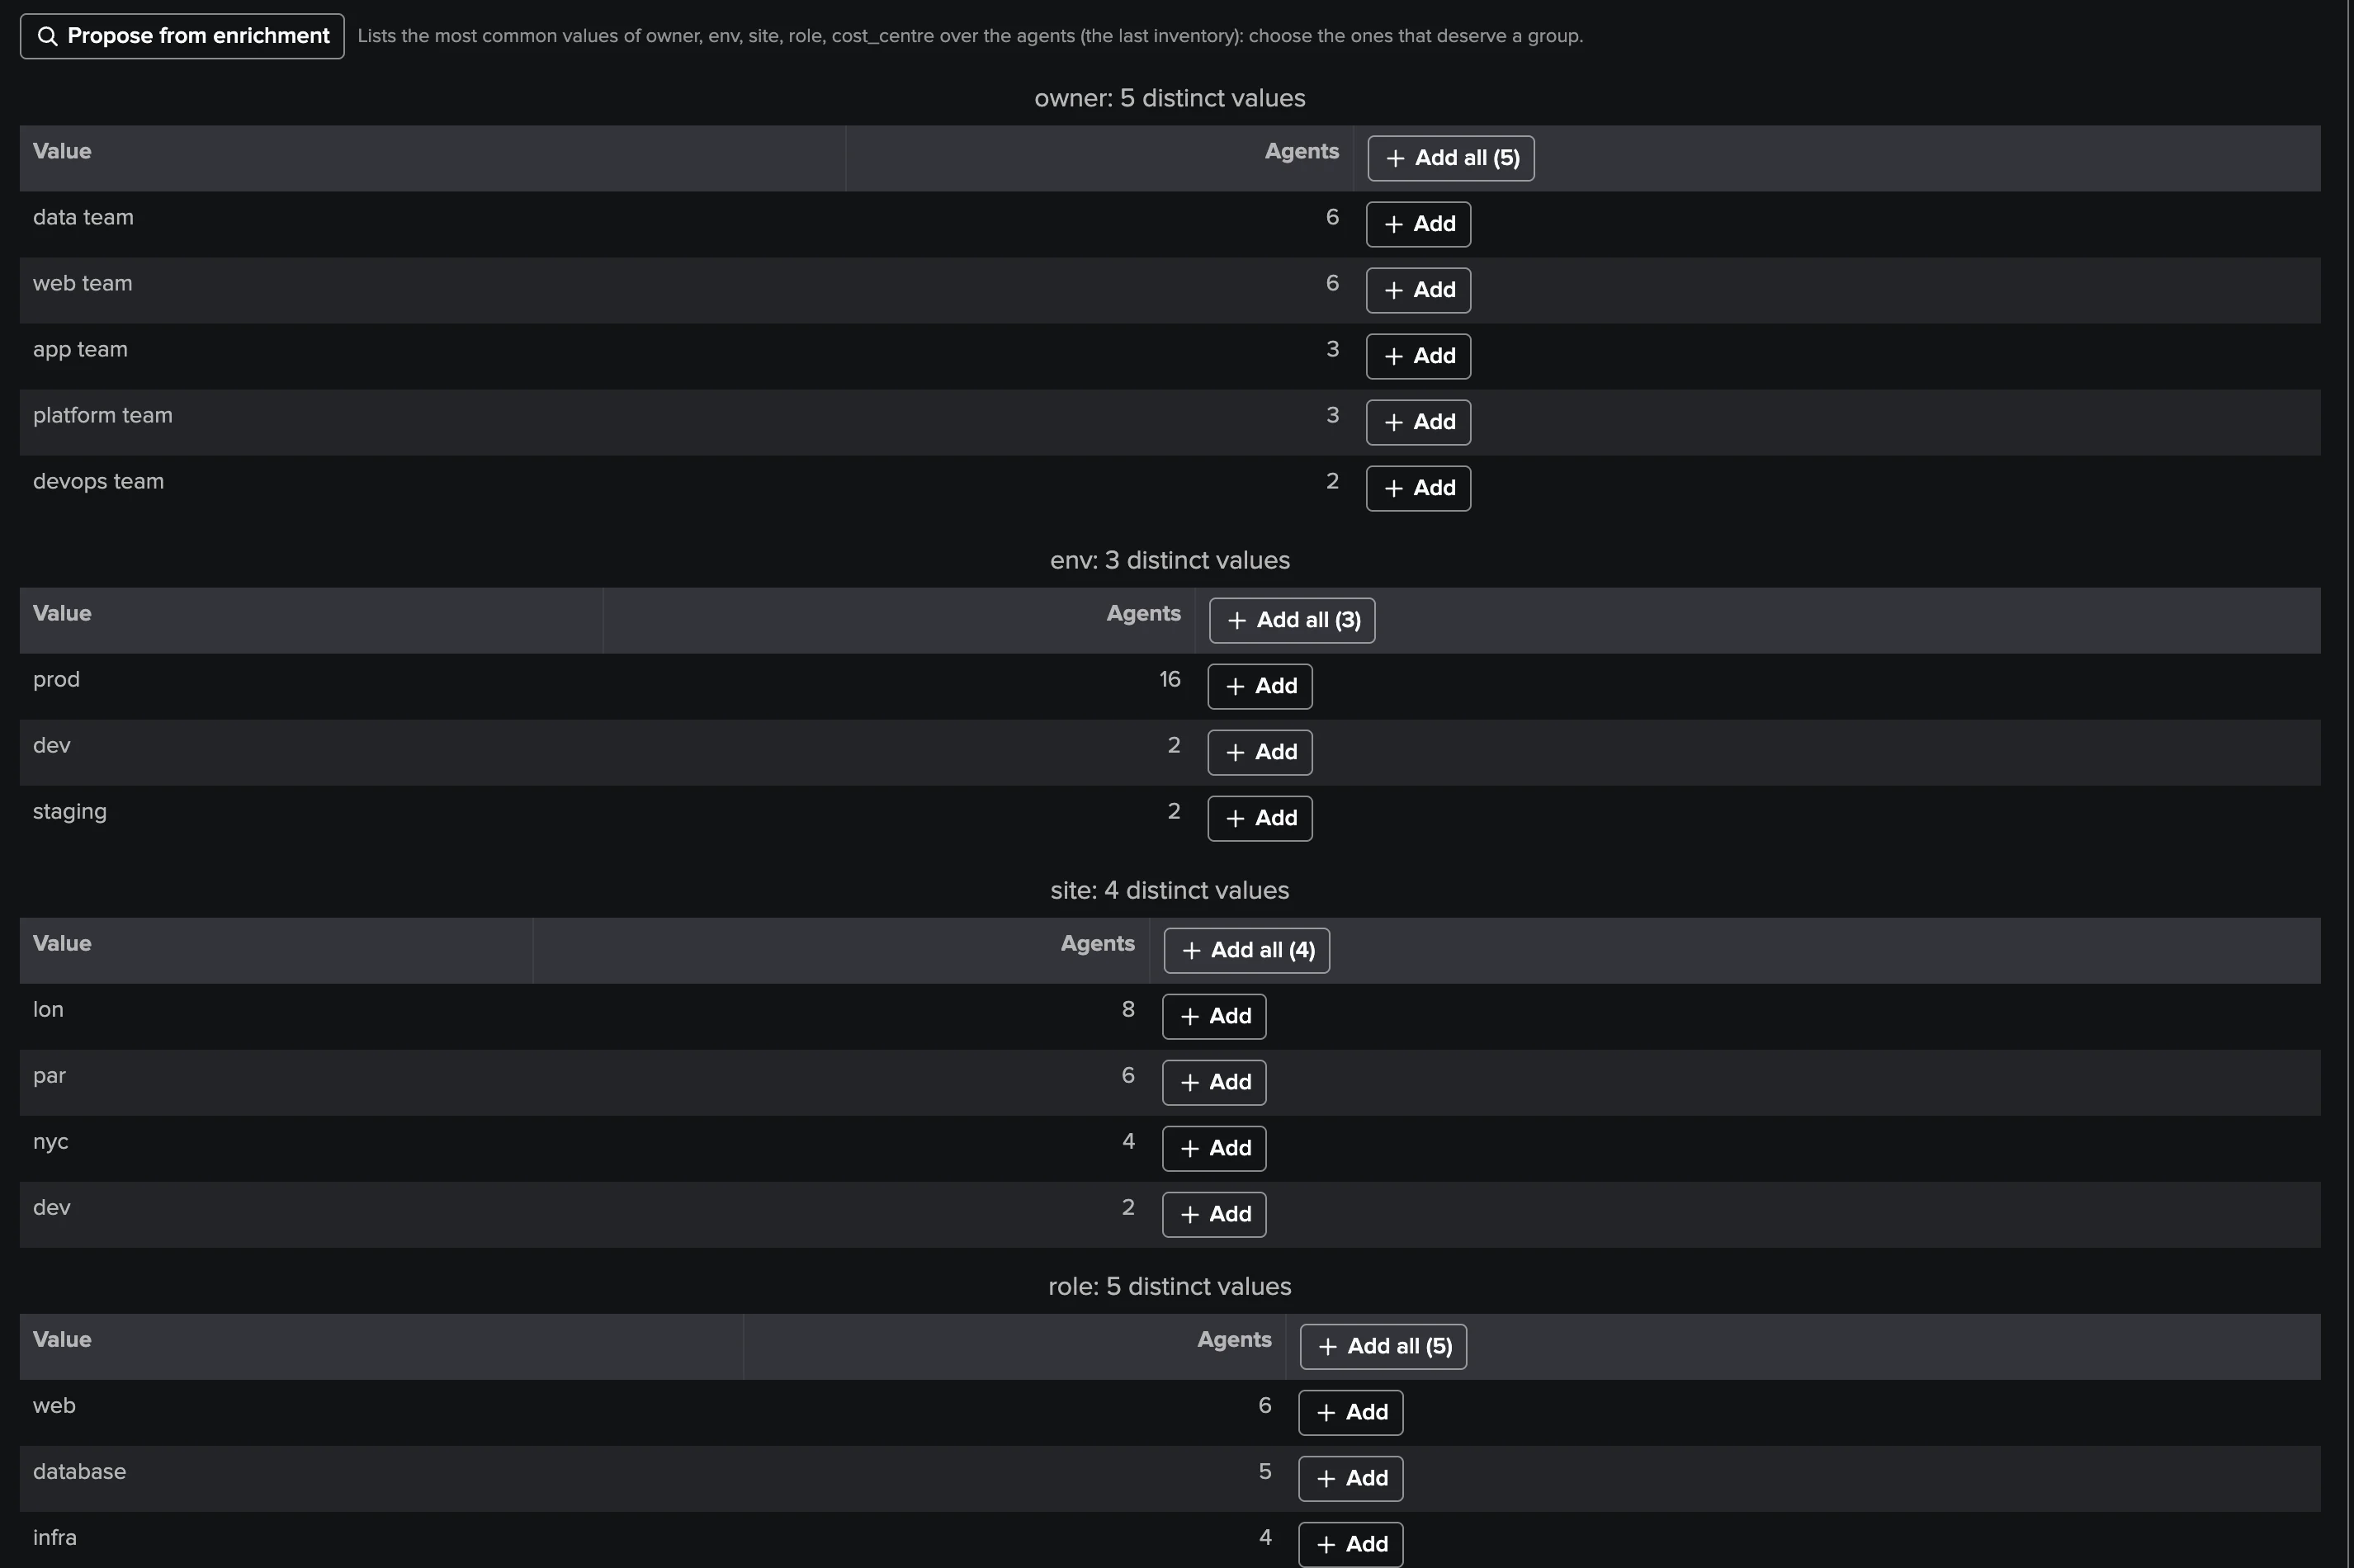
Group agents by Deployment Server, server class, host name pattern, output group or lookup value — TrackMe proposes groups from what it sees — and carry your CMDB fields onto every agent and its findings.
Agents That Must Stay Connected
Name the agents that must never drop, by name, pattern or lookup: an expected agent that is missing opens a finding, even during a mass event.
Deployment Servers Included
Clients, the phonehome pace against the usual, failing app deployments, the restarts asked for, refused requests and answer time — per Deployment Server, from the indexes it already writes.
A Findings AI Agent of Its Own
The Splunk UF Fleet AI Agent reviews open findings from the facts TrackMe holds, classifies true and false positives, and recommends or applies the triage the tenant allows.
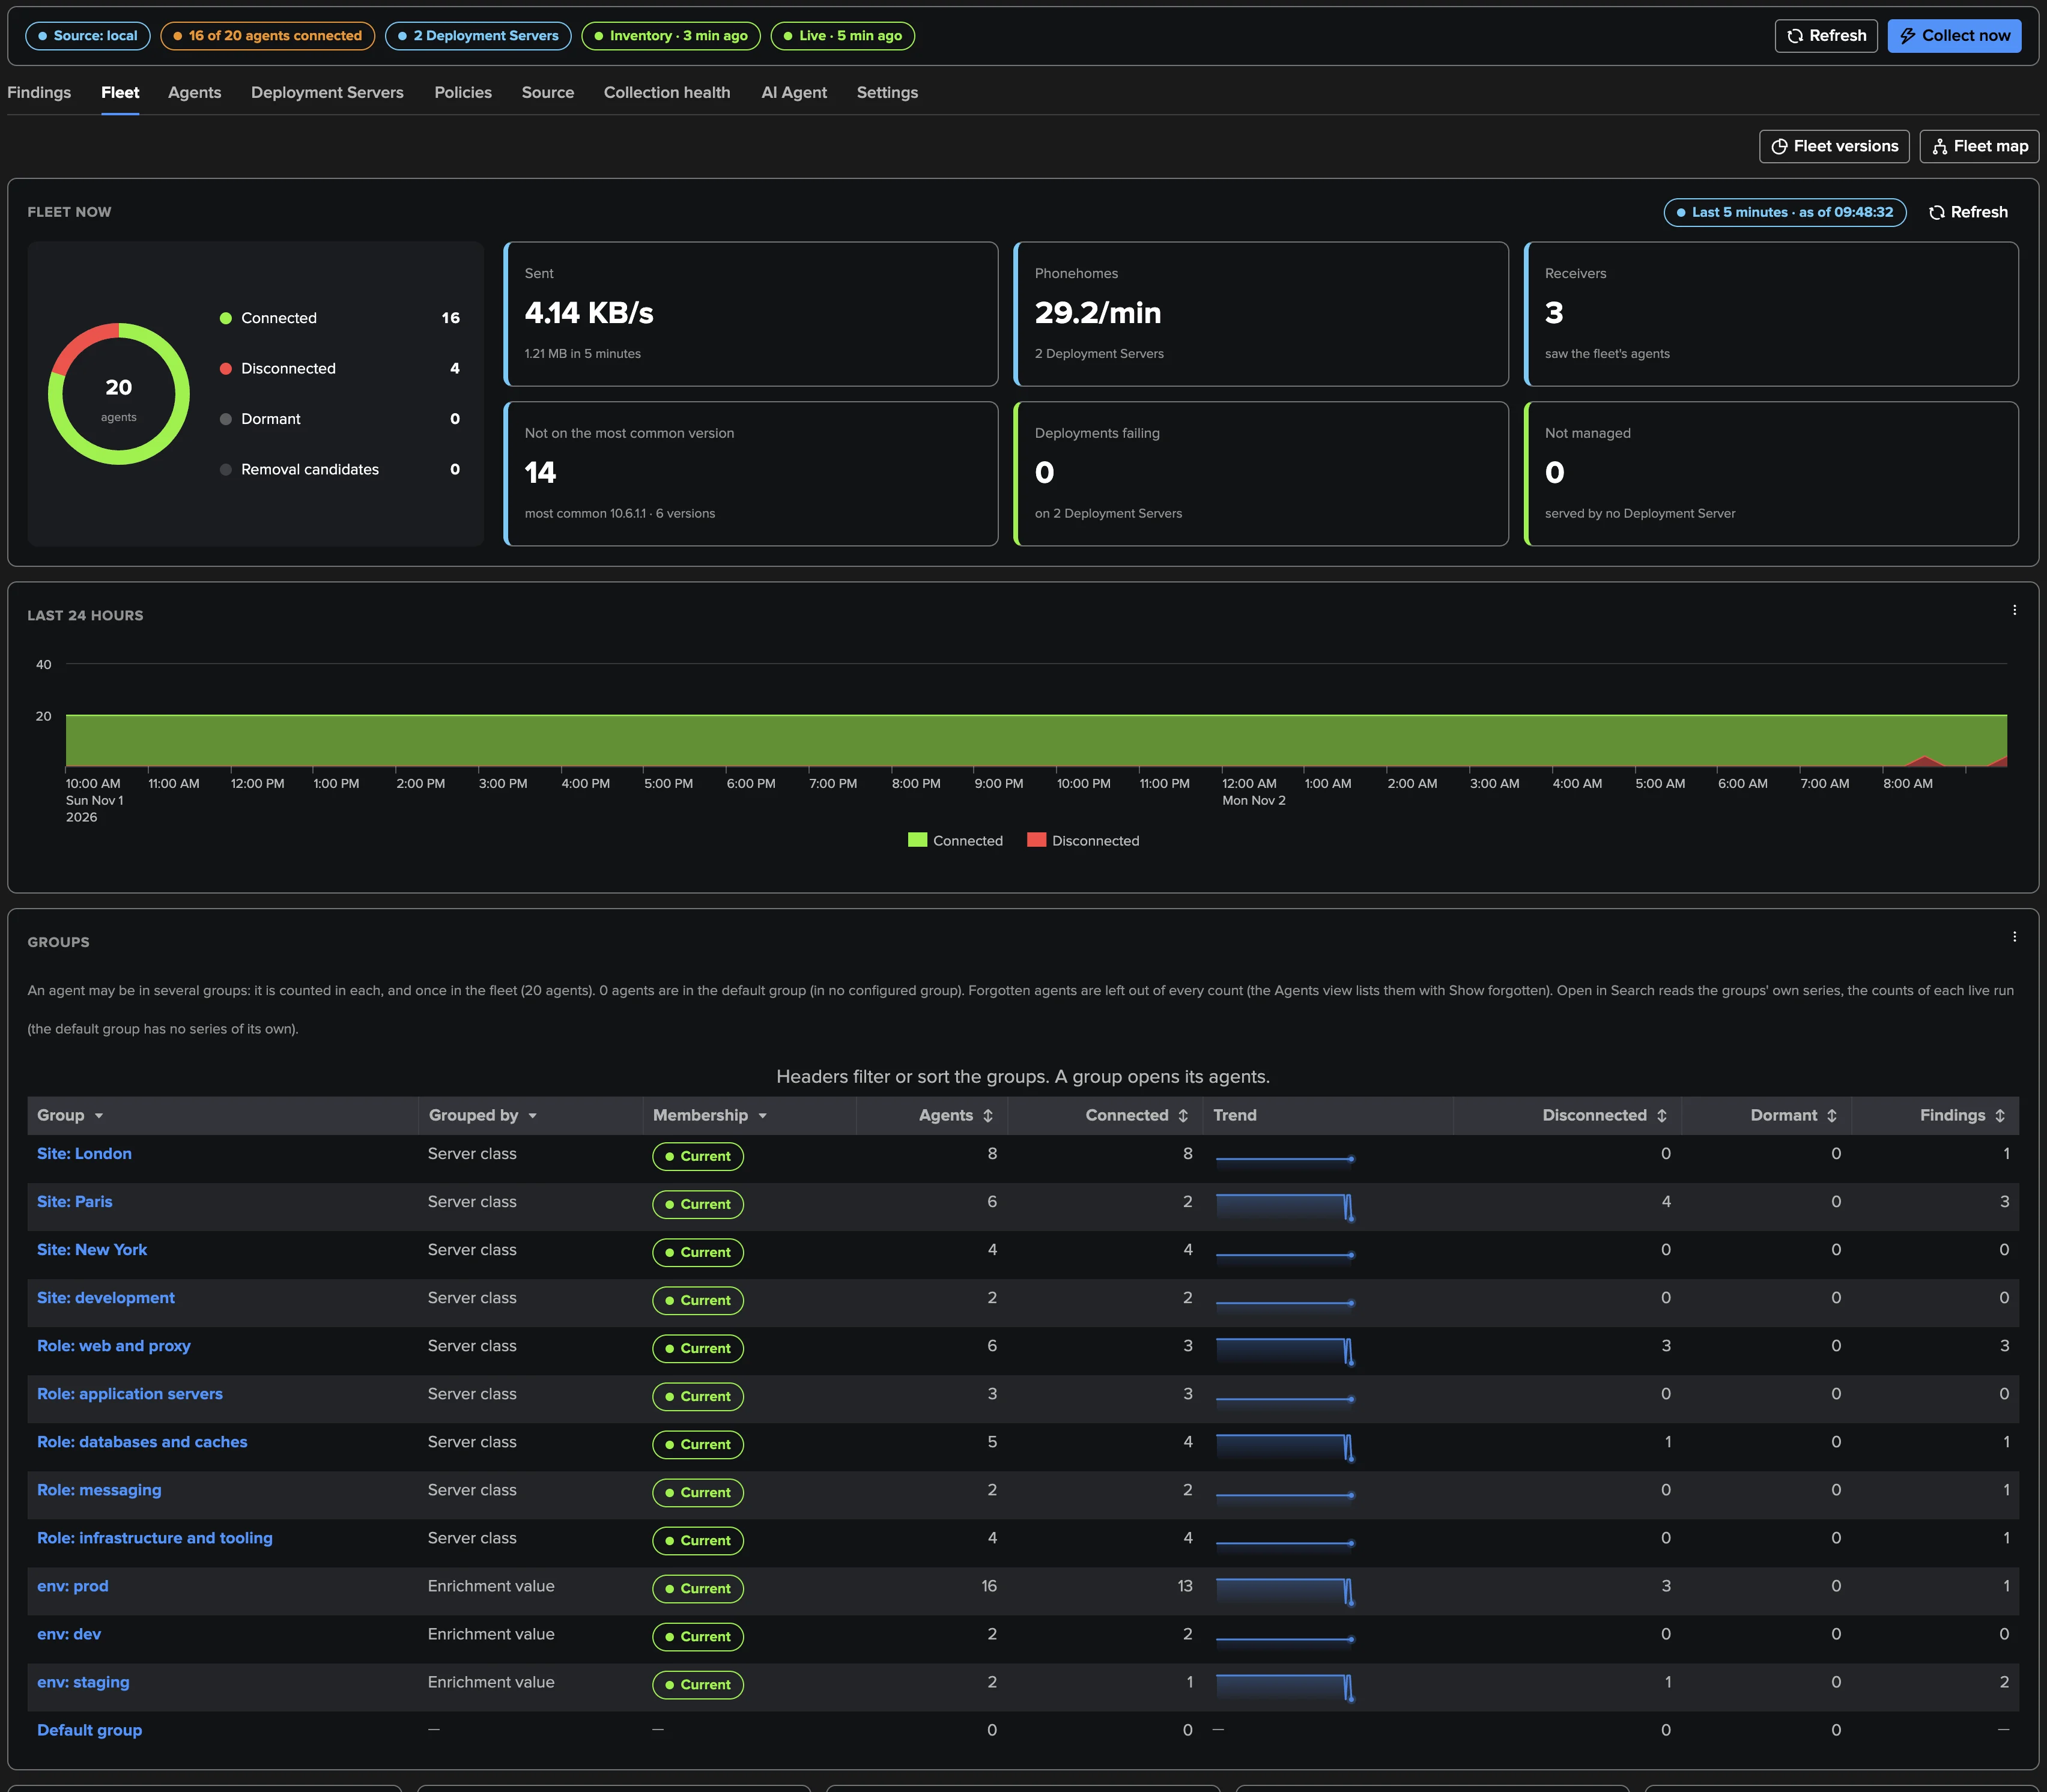
The fleet now
Connected, disconnected and dormant agents, their versions, types and platforms, their Deployment Servers, and the last 24 hours — for ten agents or a hundred thousand.
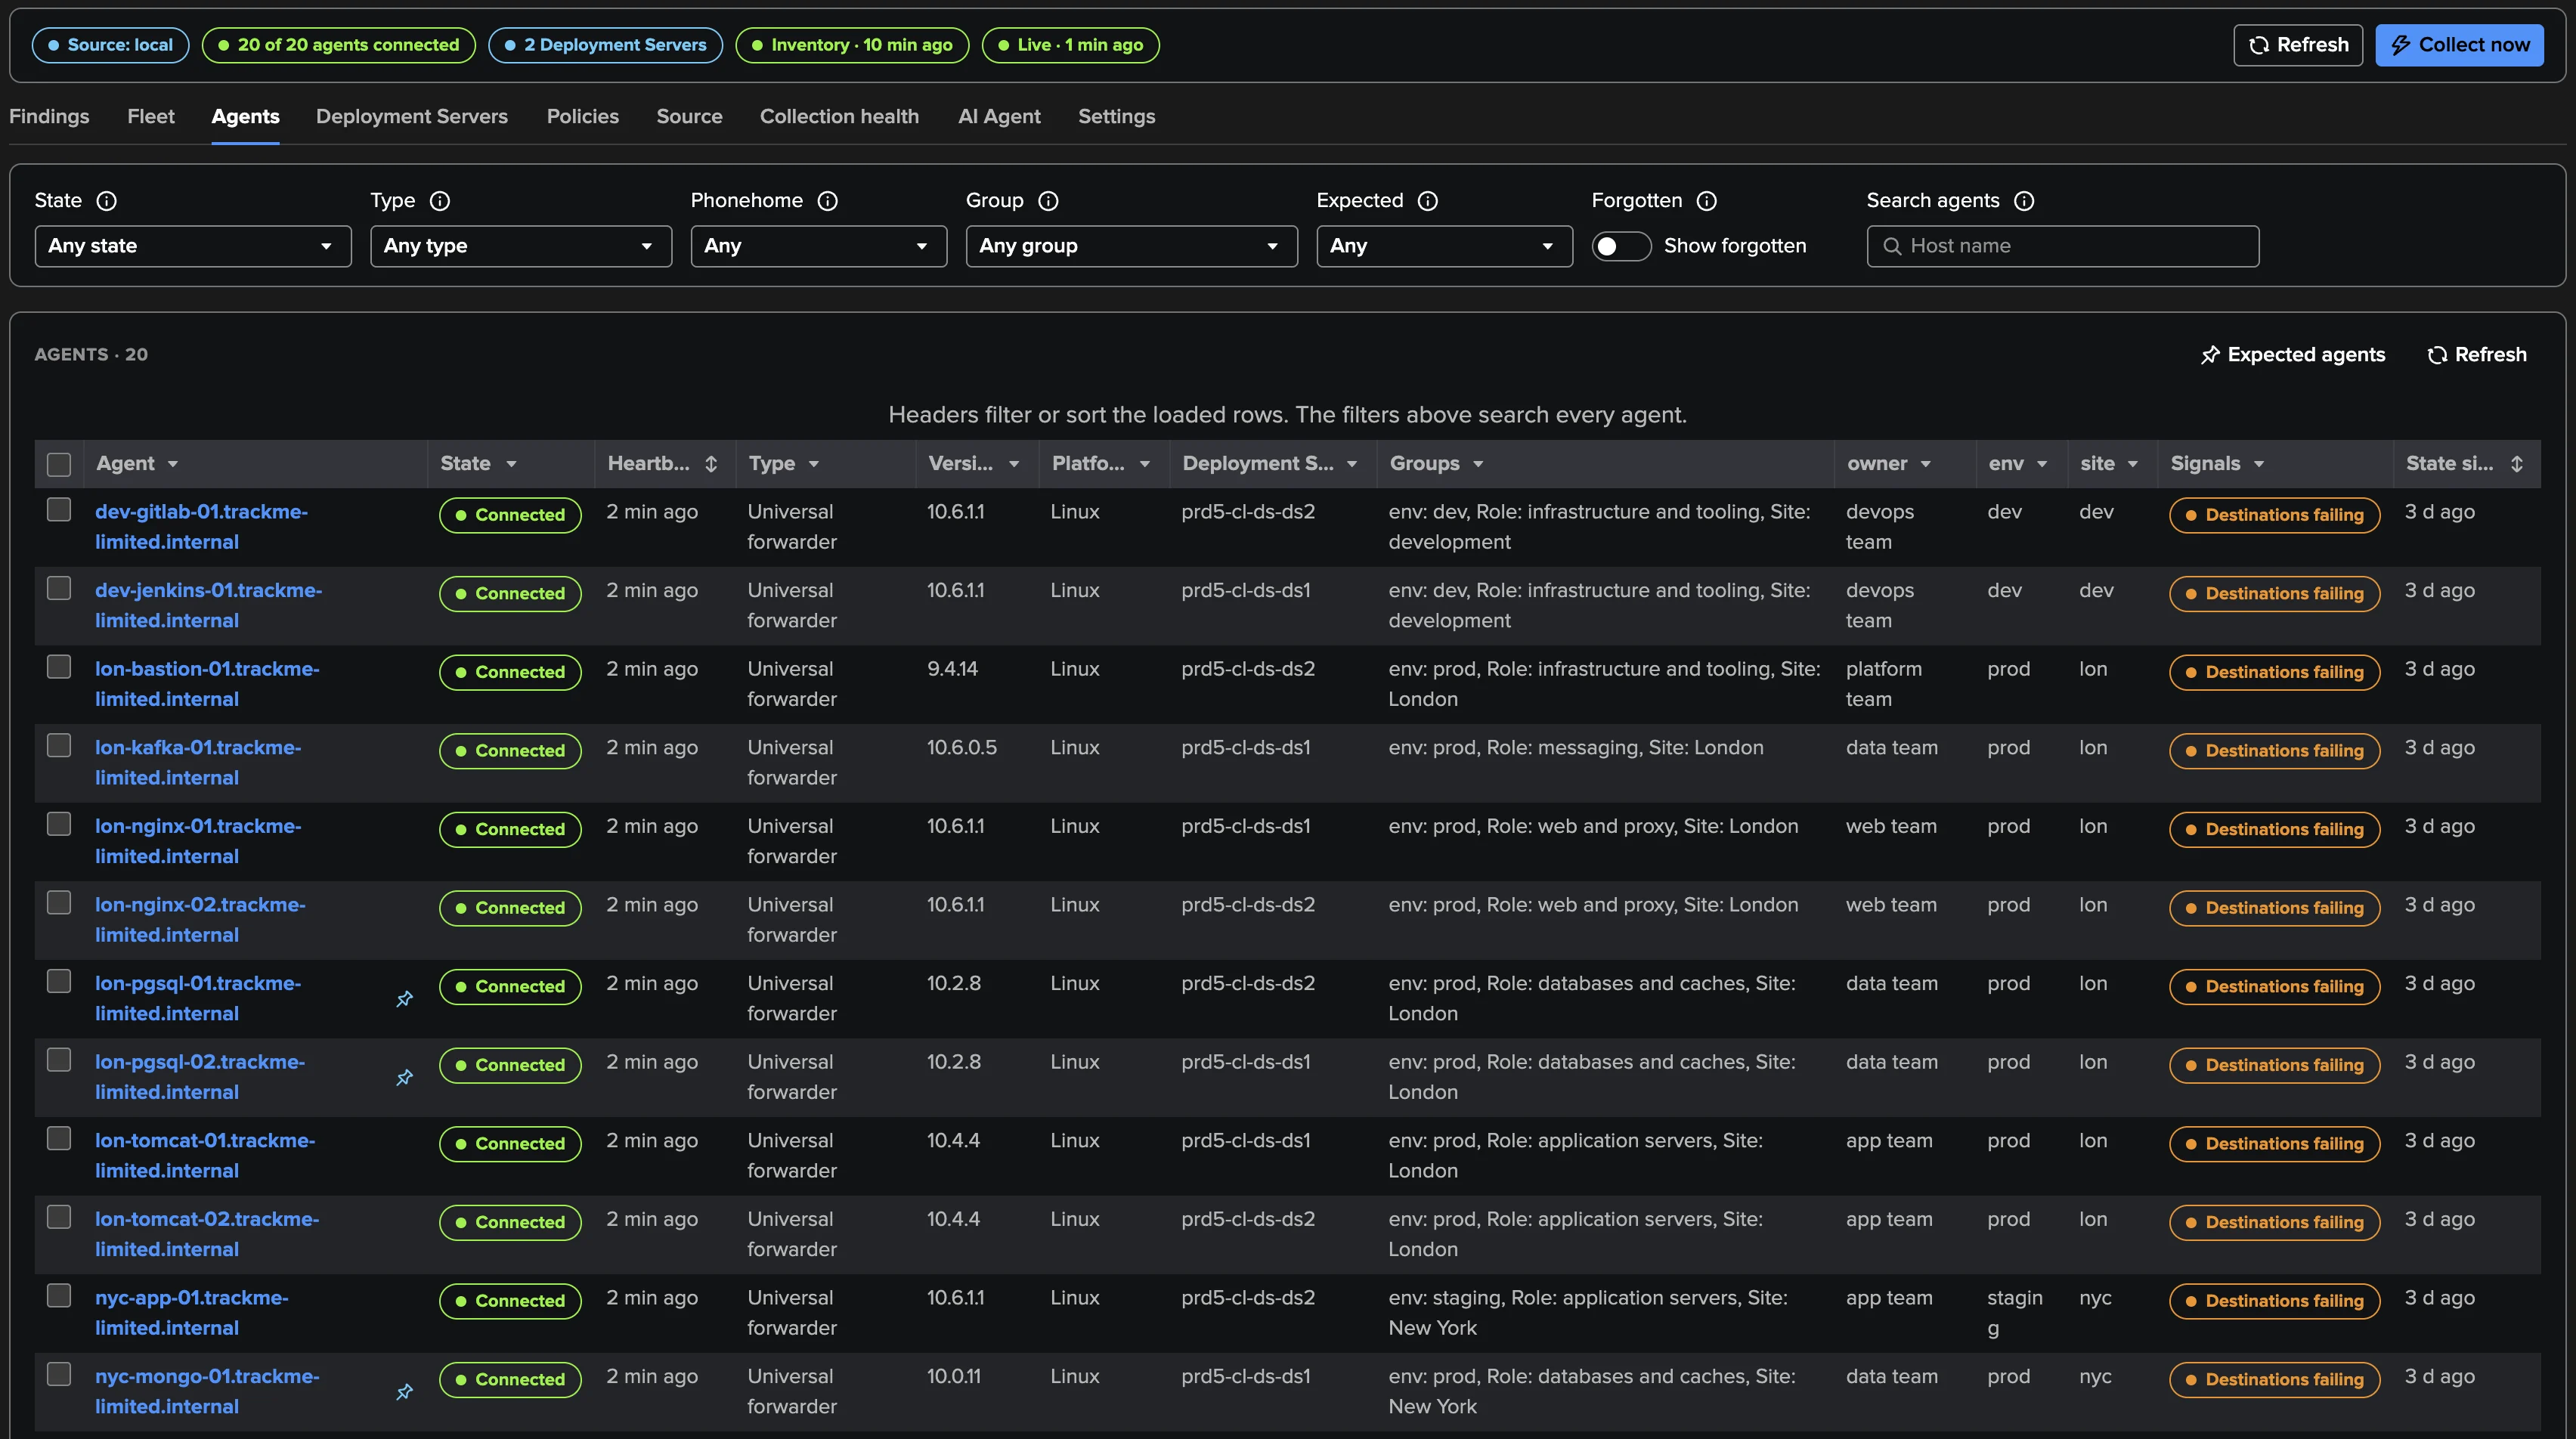
Every agent, with its context
State and since when, identity, receivers, Deployment Server and server classes, group and CMDB fields — and the troubles its own logs report when it forwards them.
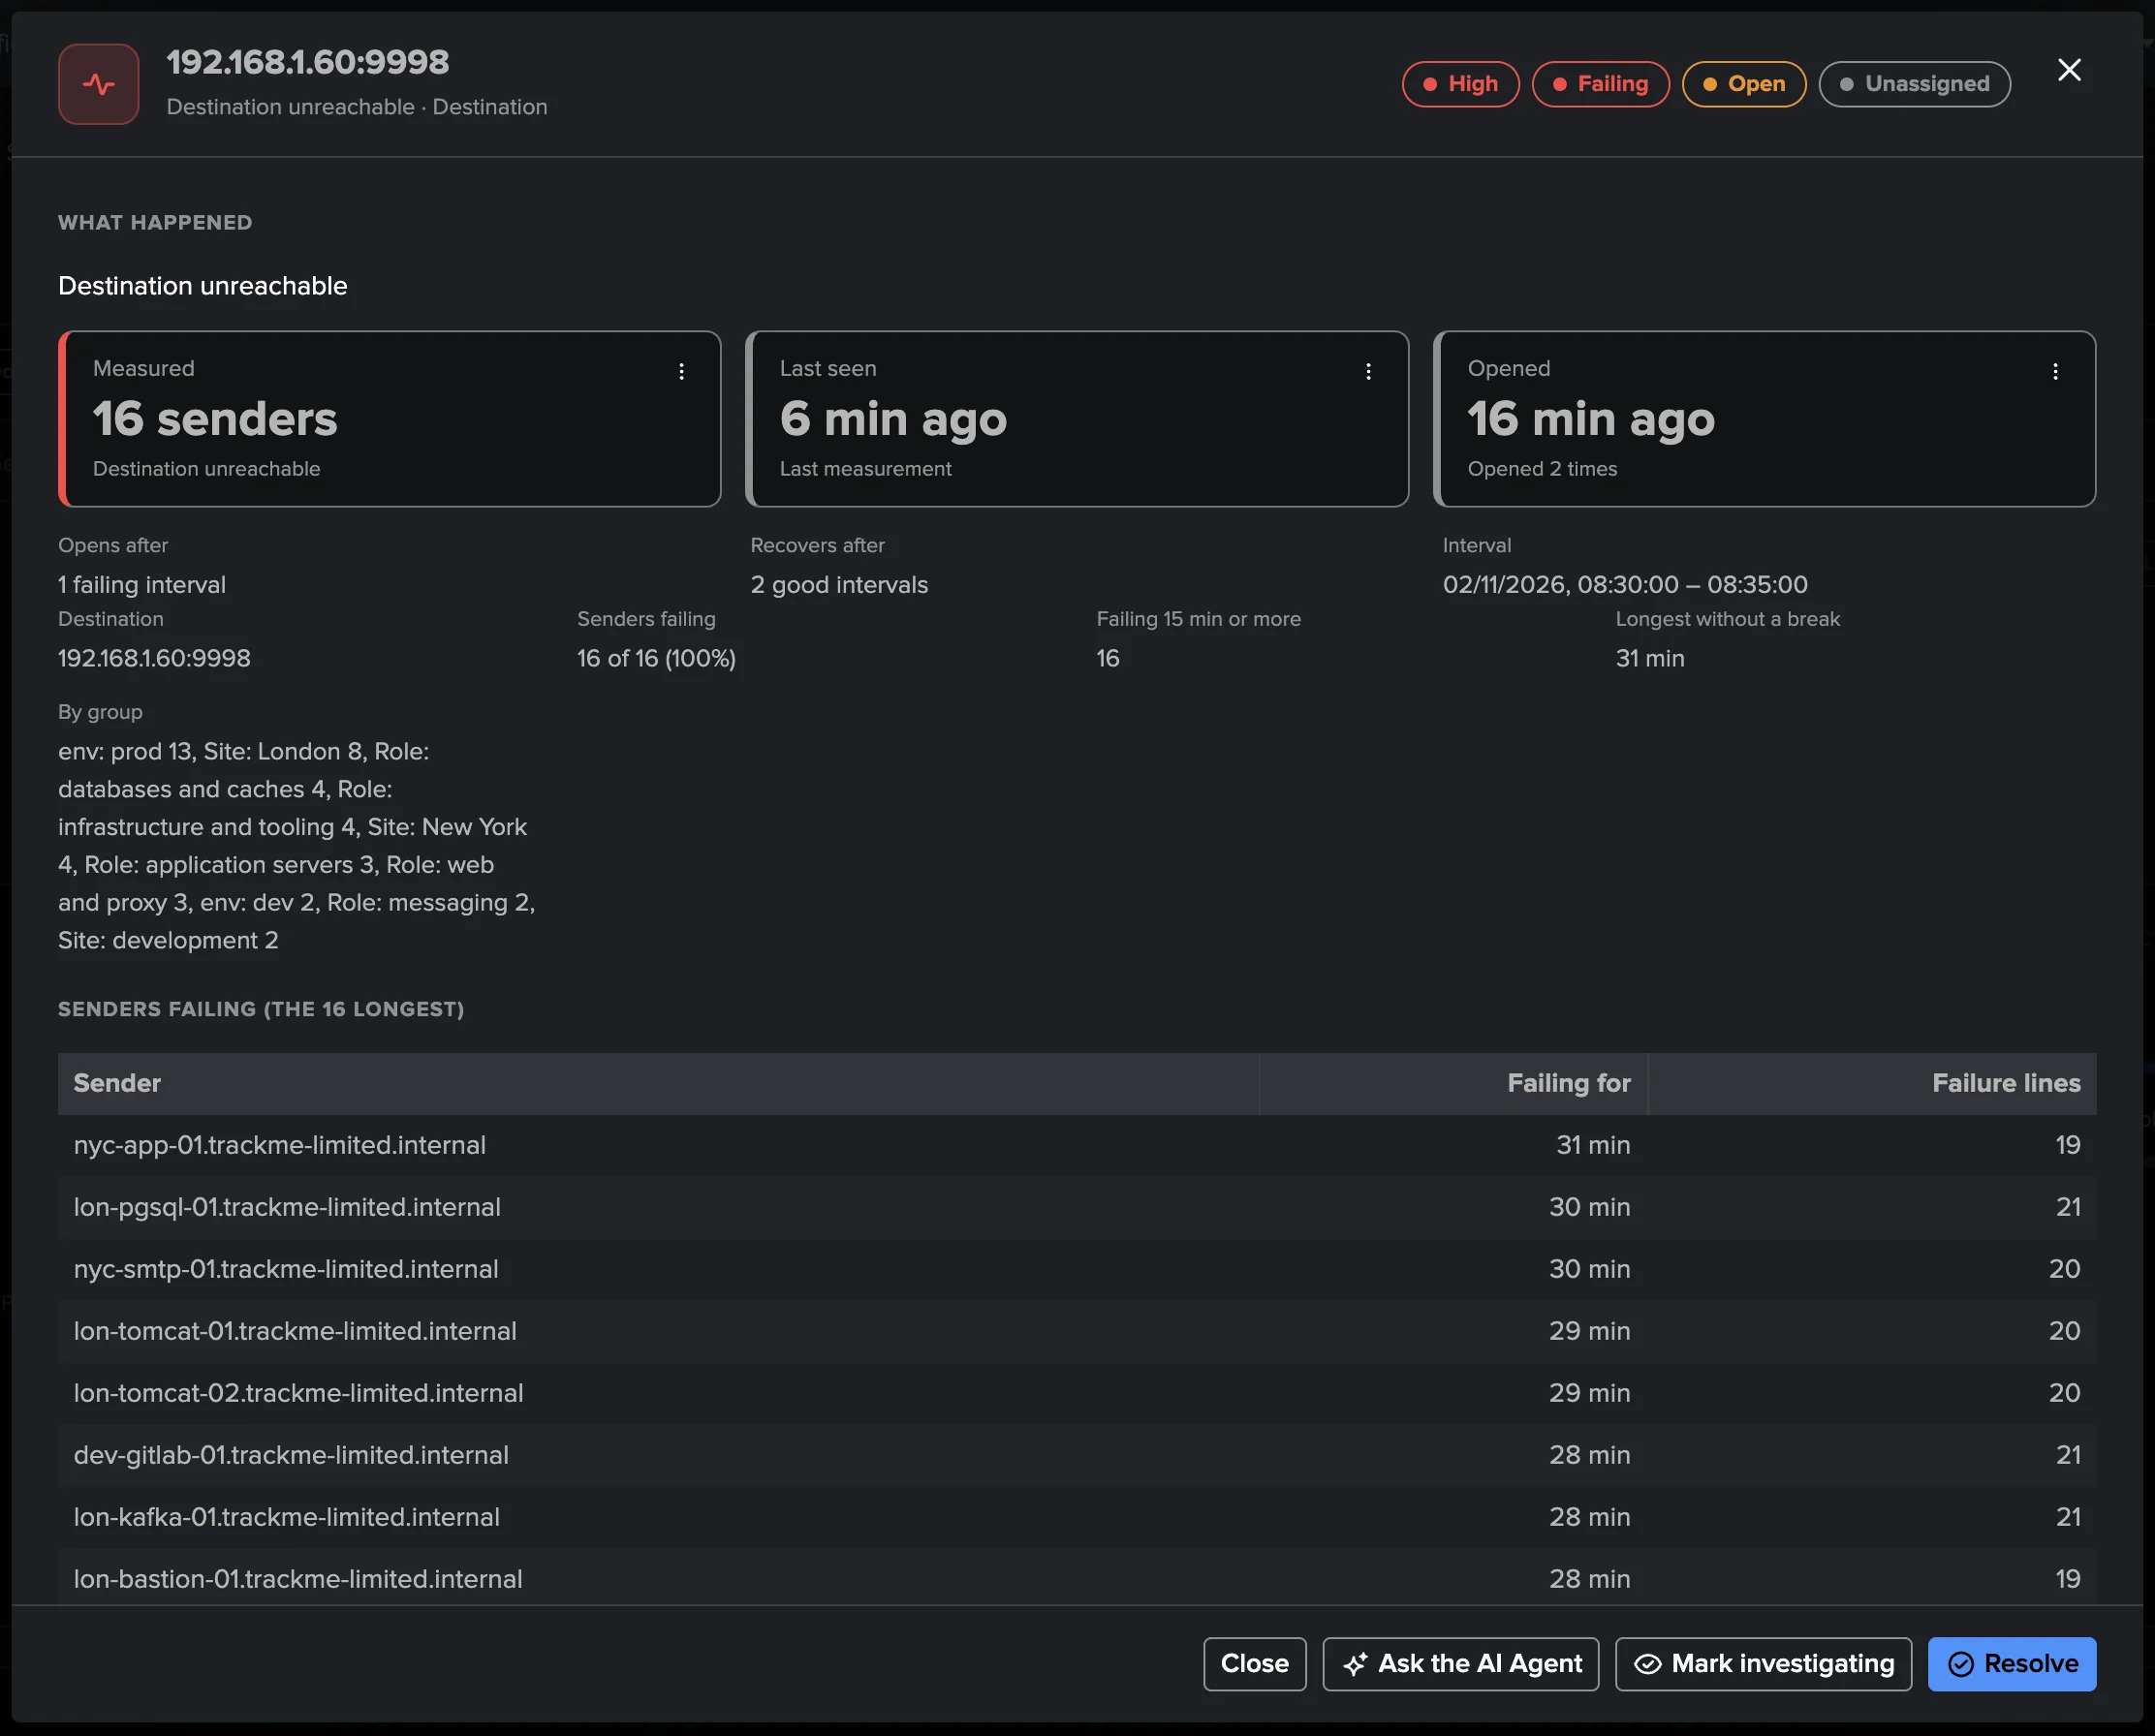
Findings that name the senders
A destination unreachable lists the agents failing to reach it, by group, with how long each has been failing.
Deployment Servers, against their usual
Each Deployment Server with its clients, its phonehome pace against its own baseline, and the deployments it could not complete.

Deep Dive
Explore the key aspects of Splunk UF Fleet in detail.
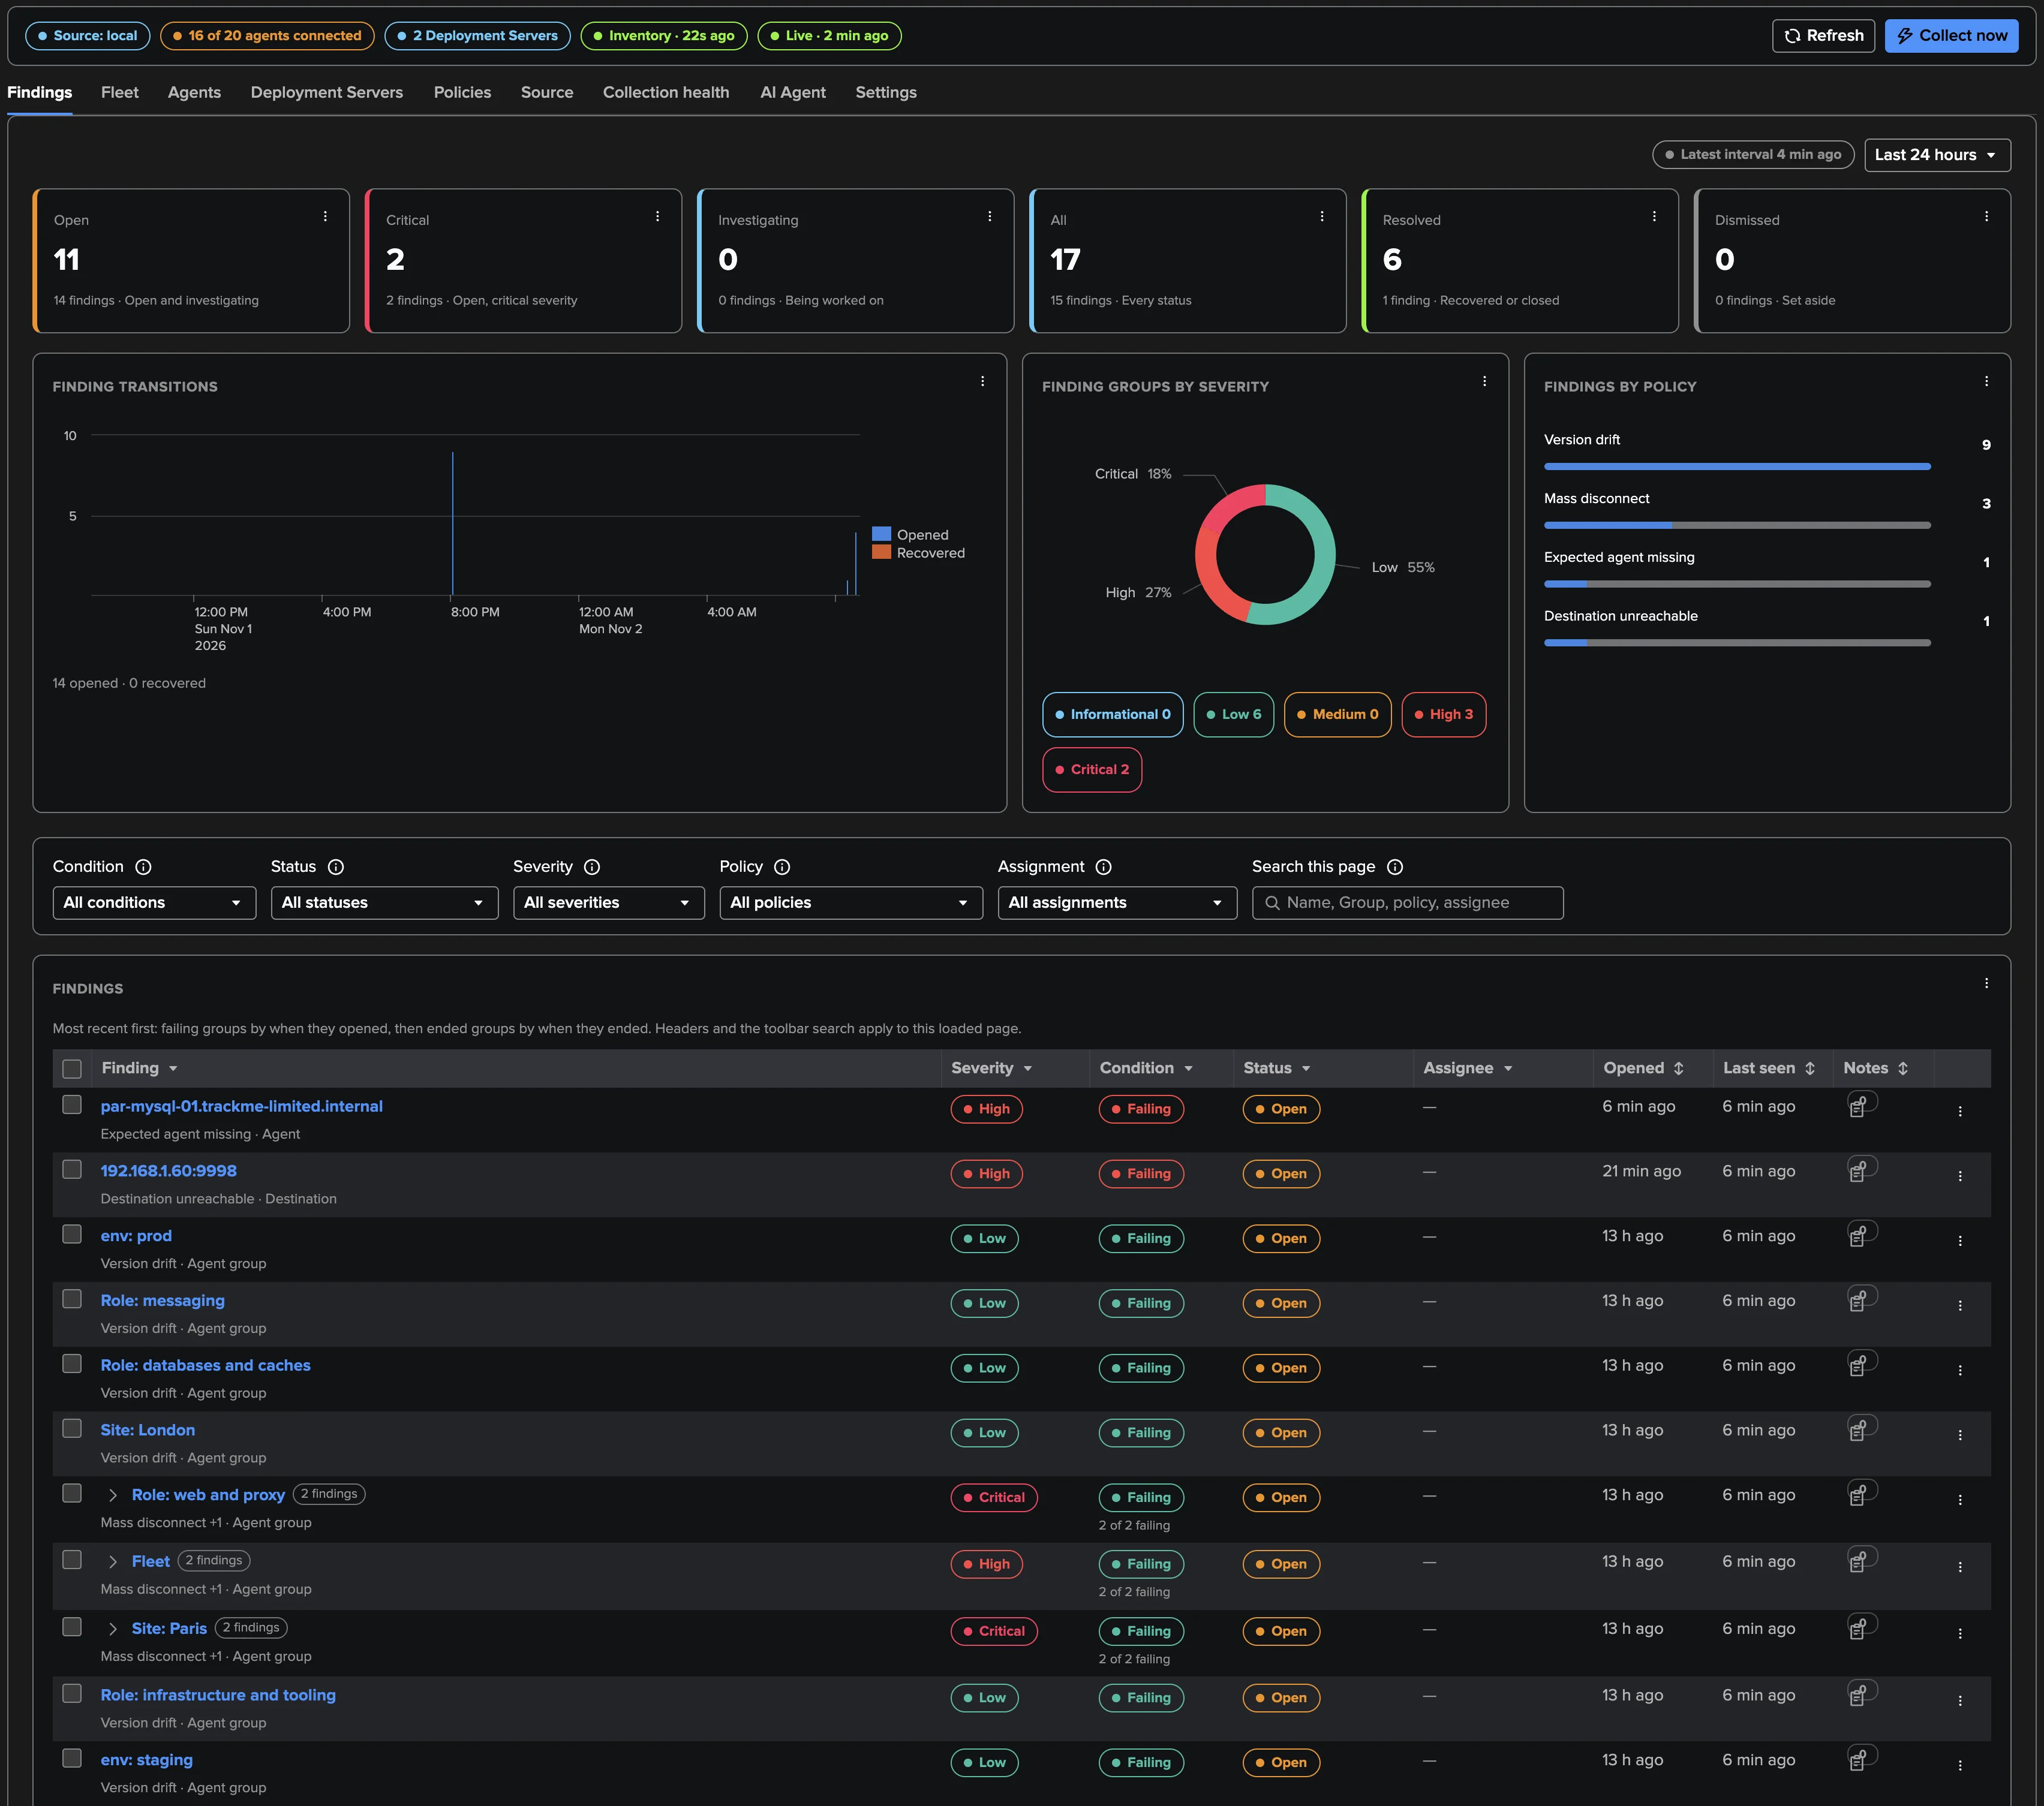
Your forwarding fleet, accounted for
How many agents do you have, on which versions? Which are connected, disconnected or dormant, and since when? Which must stay connected and are not? Which are blocked, throttled, failing their destinations or restarting in a loop? The Splunk UF Fleet tenant answers from what Splunk already writes — the receivers’ connection lines, the agents’ own internal logs and the Deployment Server indexes — and never calls an agent.
The receiving side has its own tenant type, Splunk S2S; the forwarders used as collection points theirs, Splunk Forwarder Collectors.
Read the Splunk UF Fleet guide or take the guided tour.
Related Features
Ready to get started?
Request a free 90-day trial with all features enabled. No restrictions.